performed at the
THI Cardiovascular Research Laboraroty of Dr. Doreen Rosenstrauch, M.D.
Joy Chavez (Undergraduate Student at UH)
Dr. Craig Hartley (Baylor College of Medicine)
Dr. Doreen Rosenstrauch (Texas Heart Insitute)
Hassan Khalil (Undergraduate Student at UH)
Prof. Suncica Canic (UH)
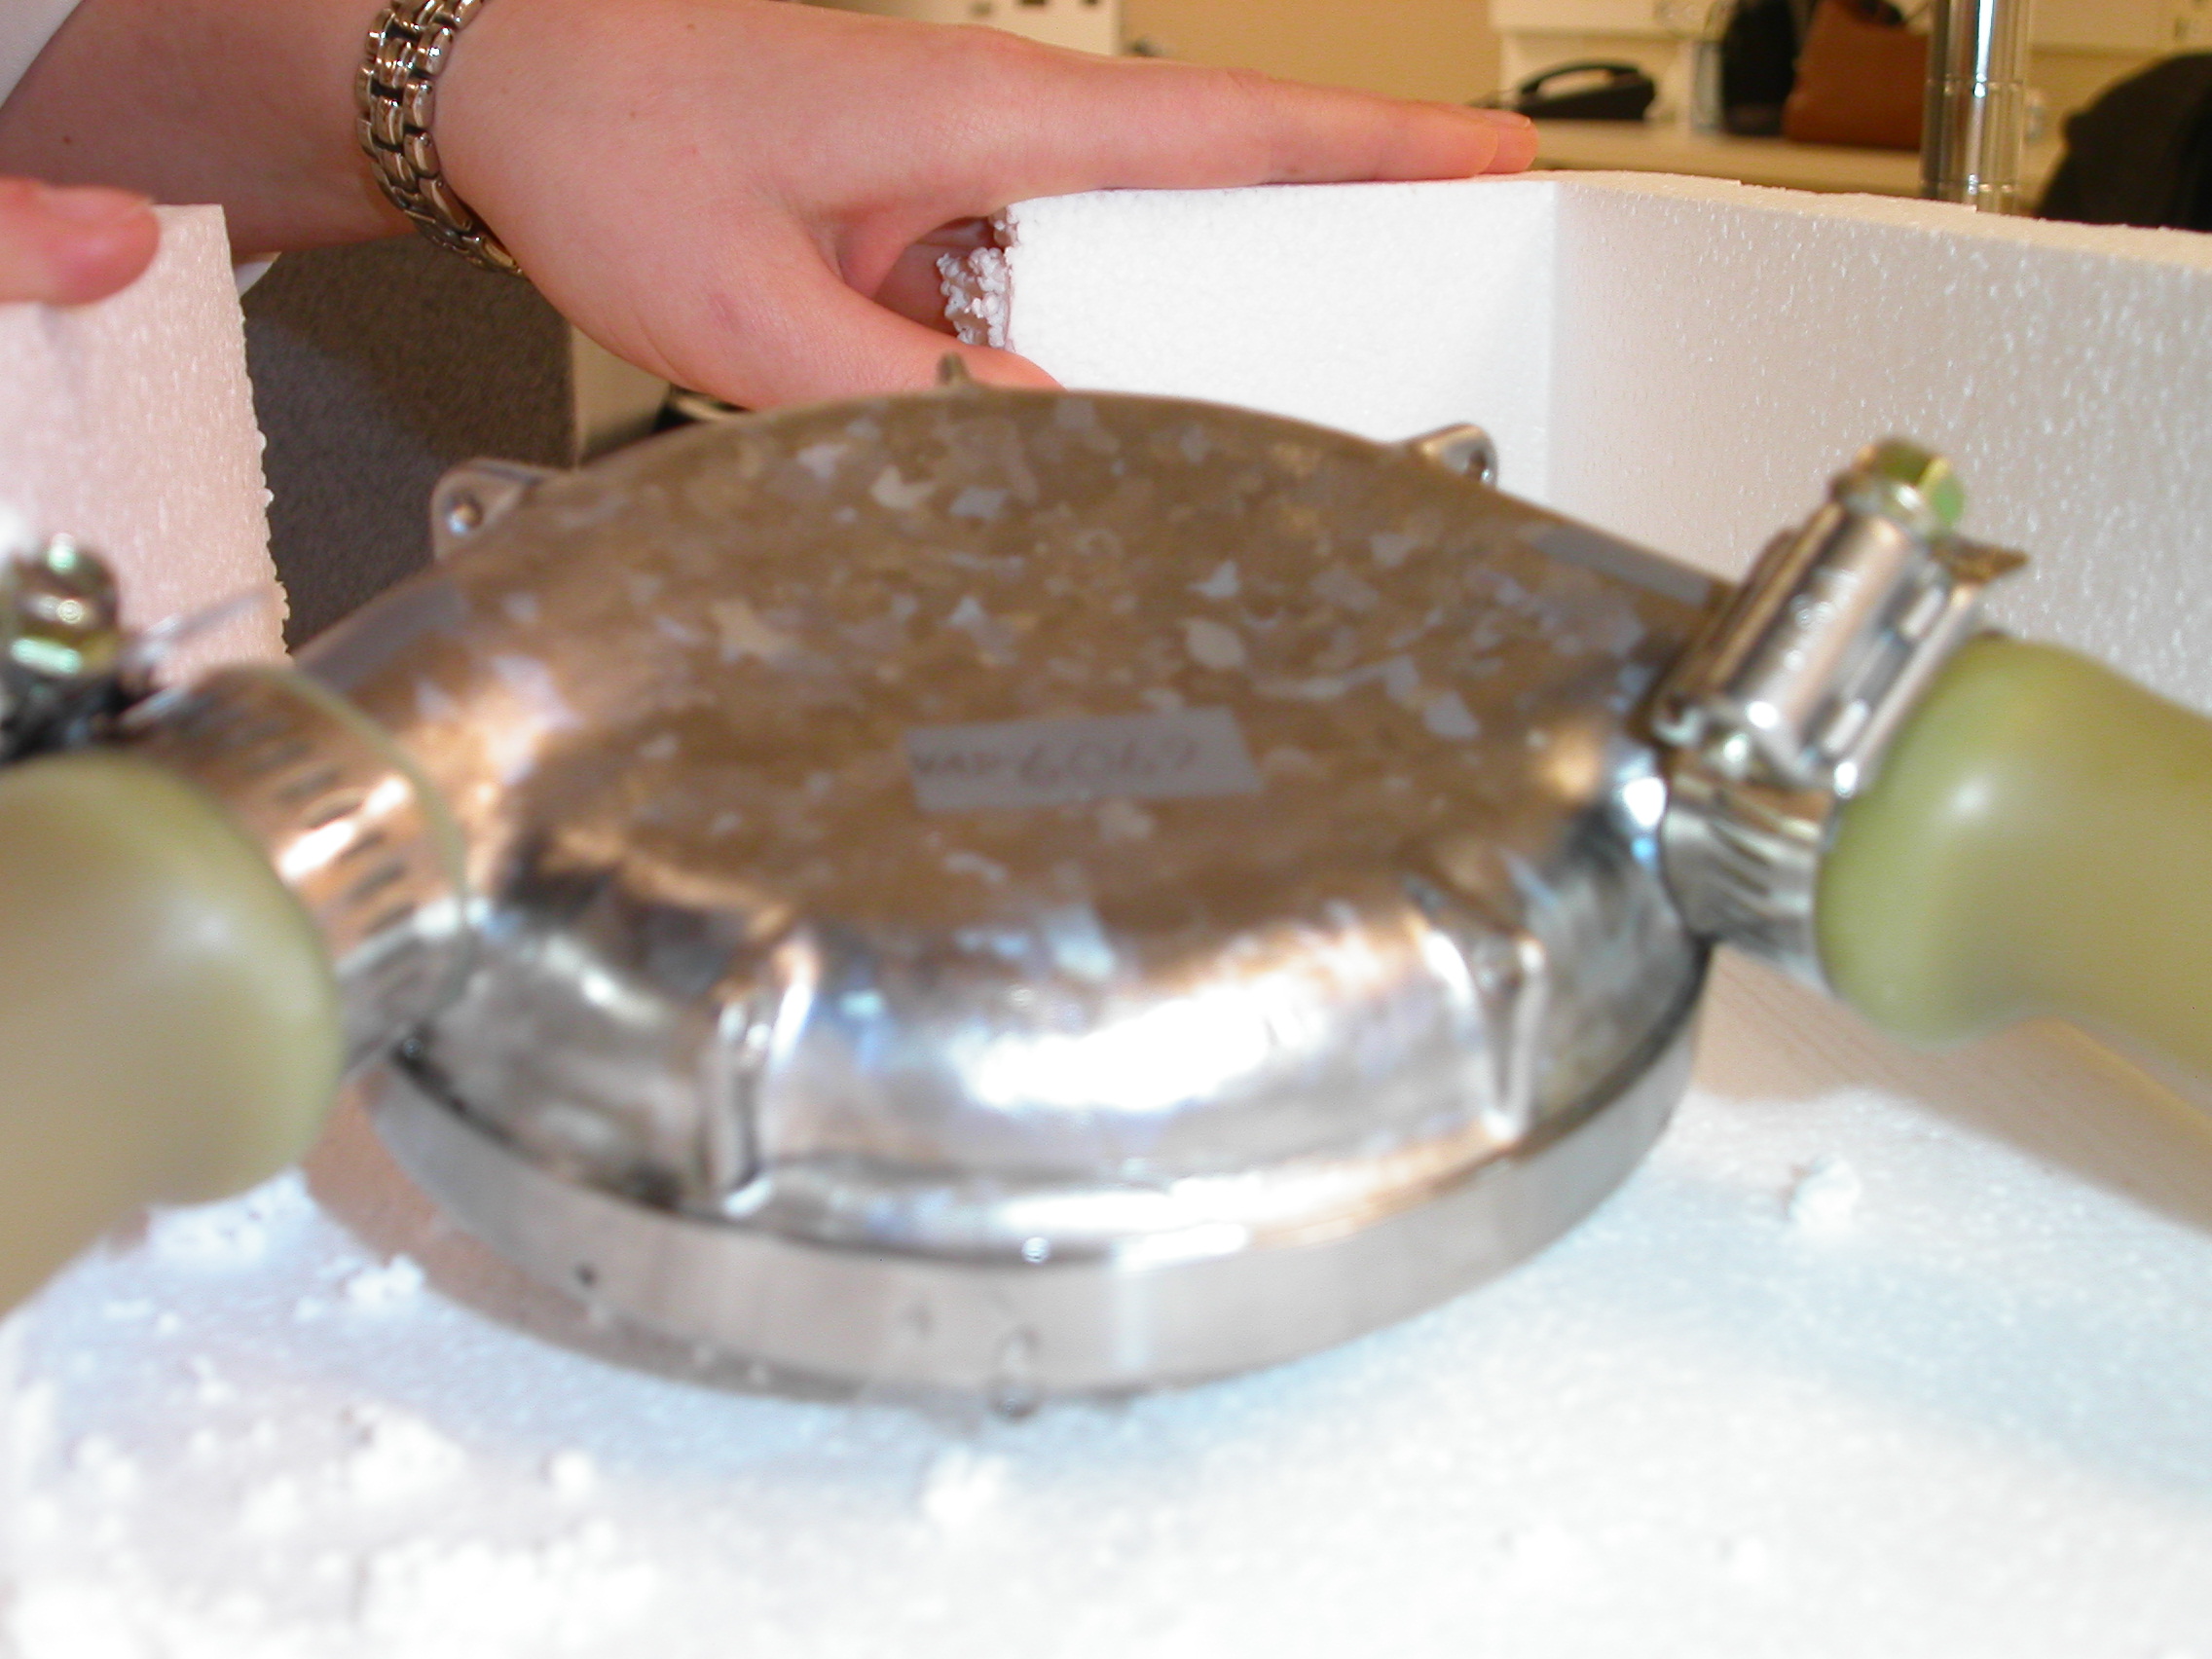
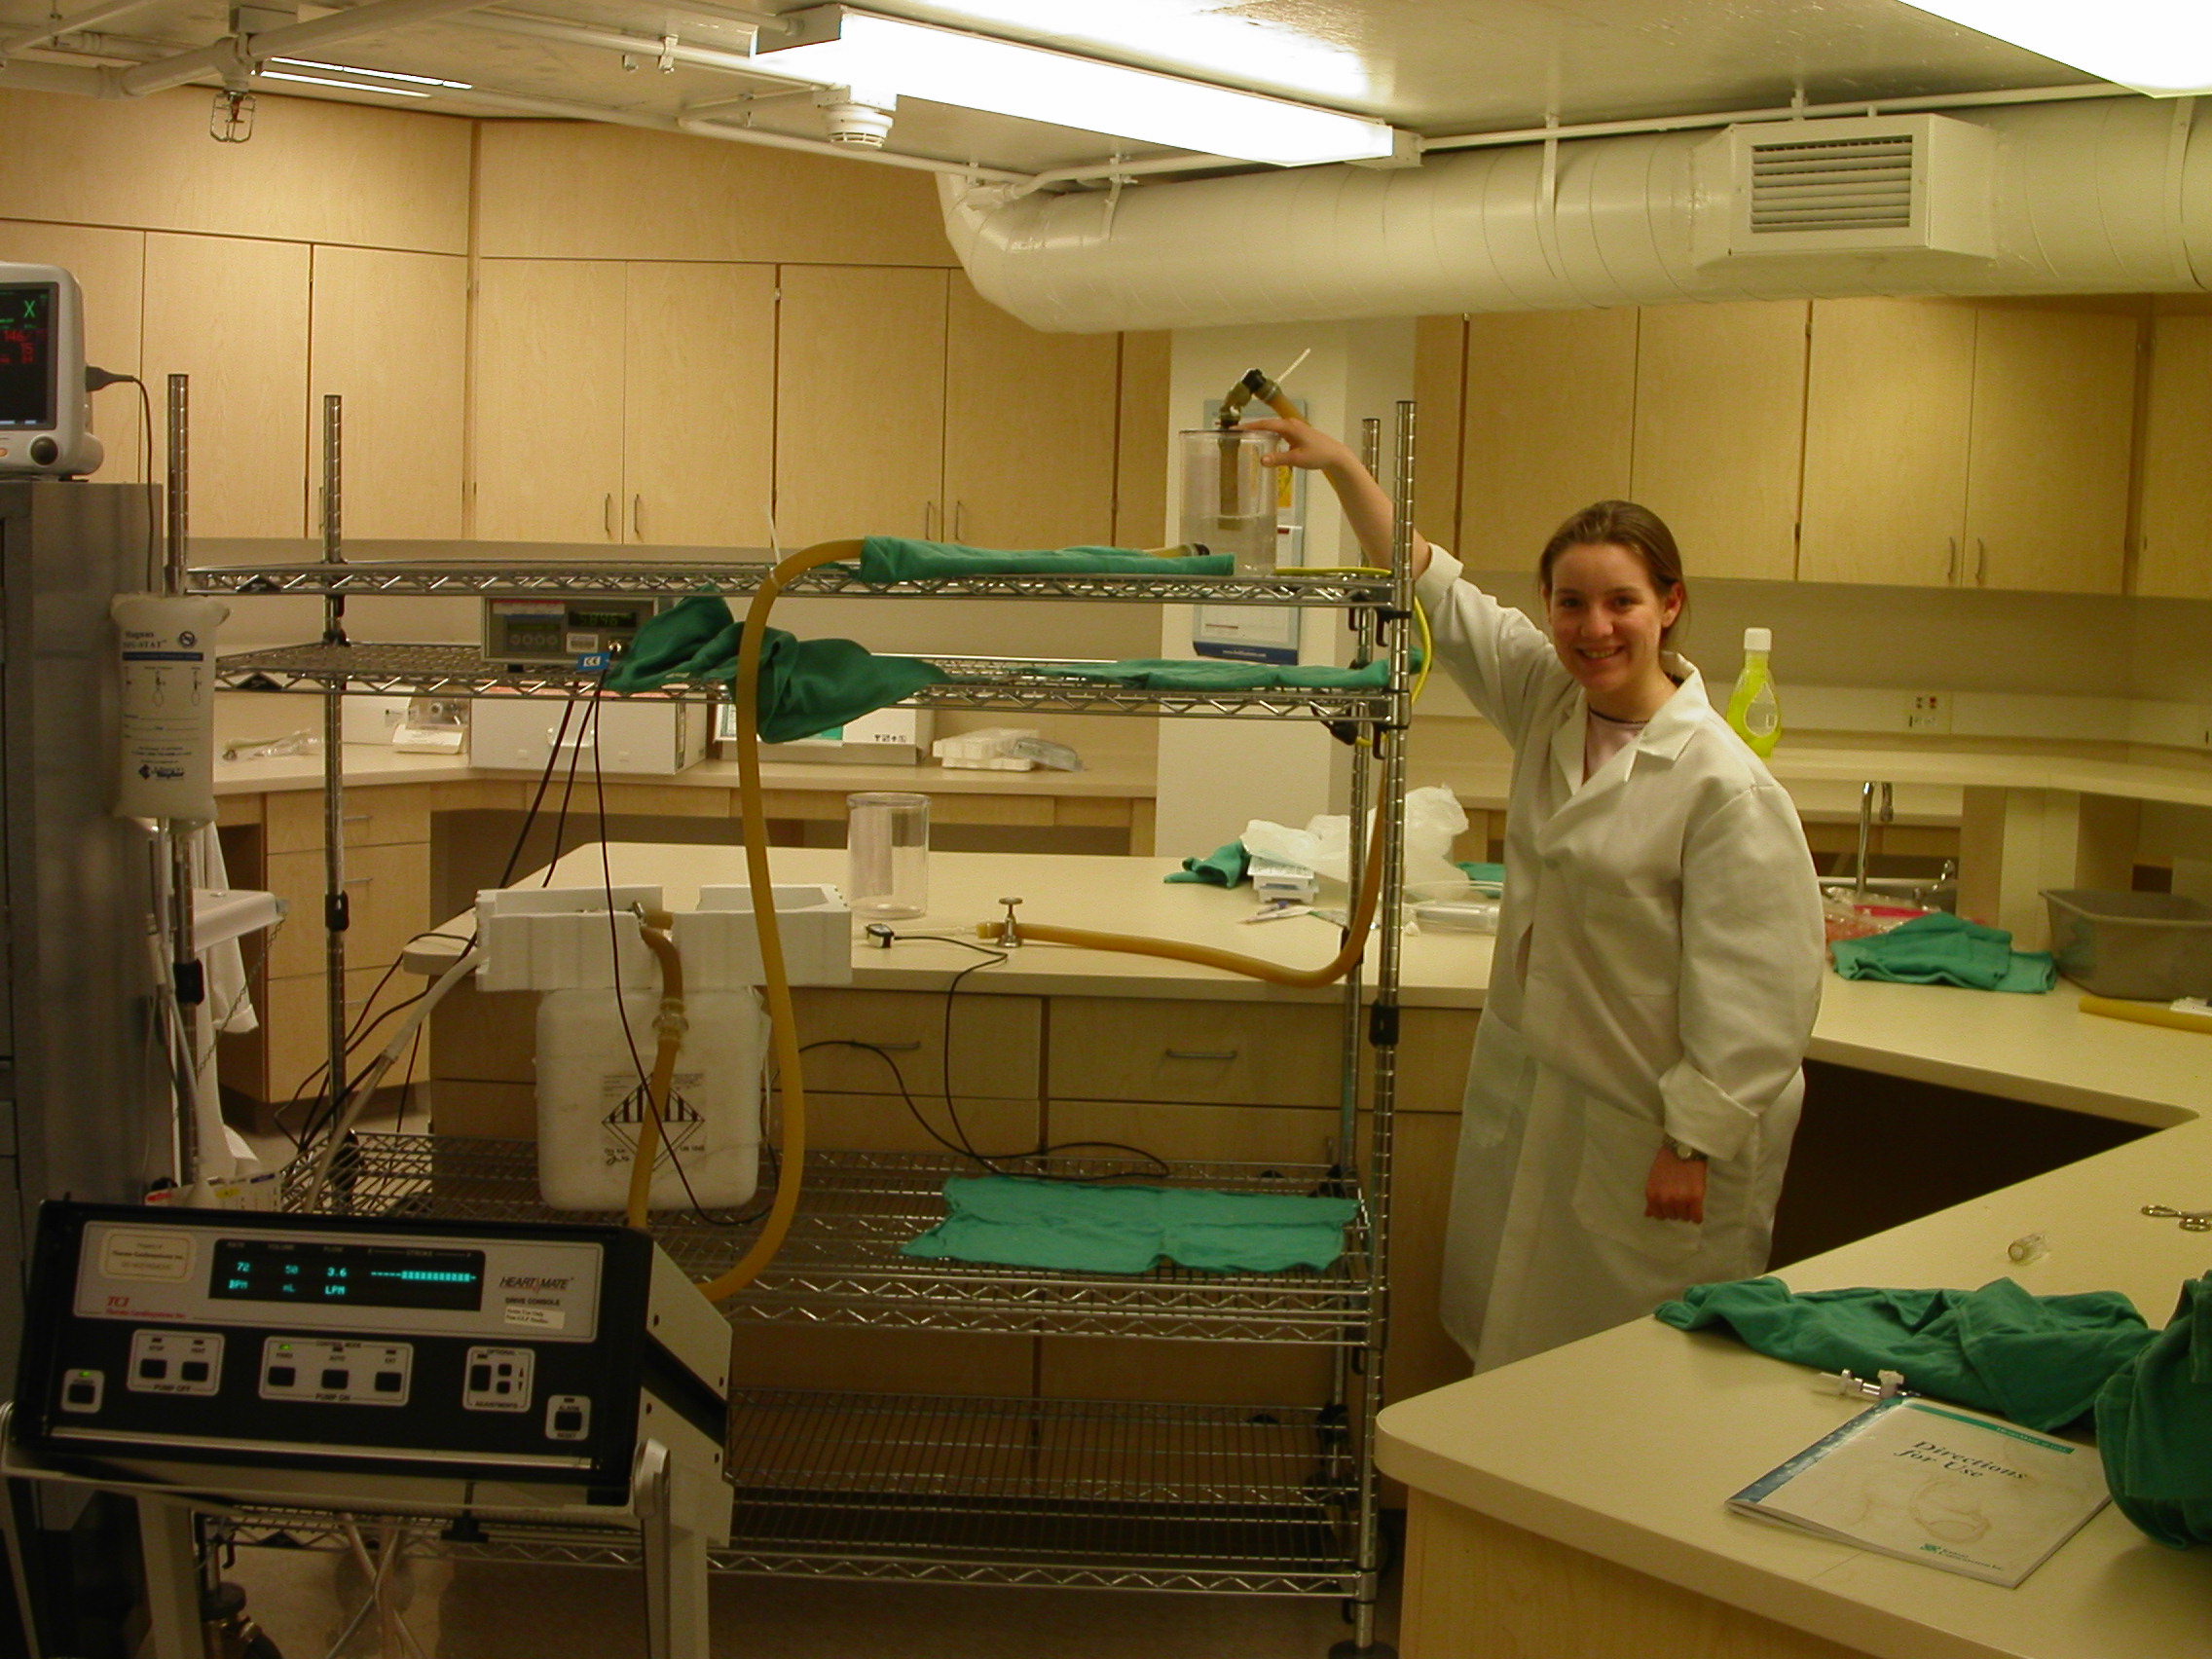
The
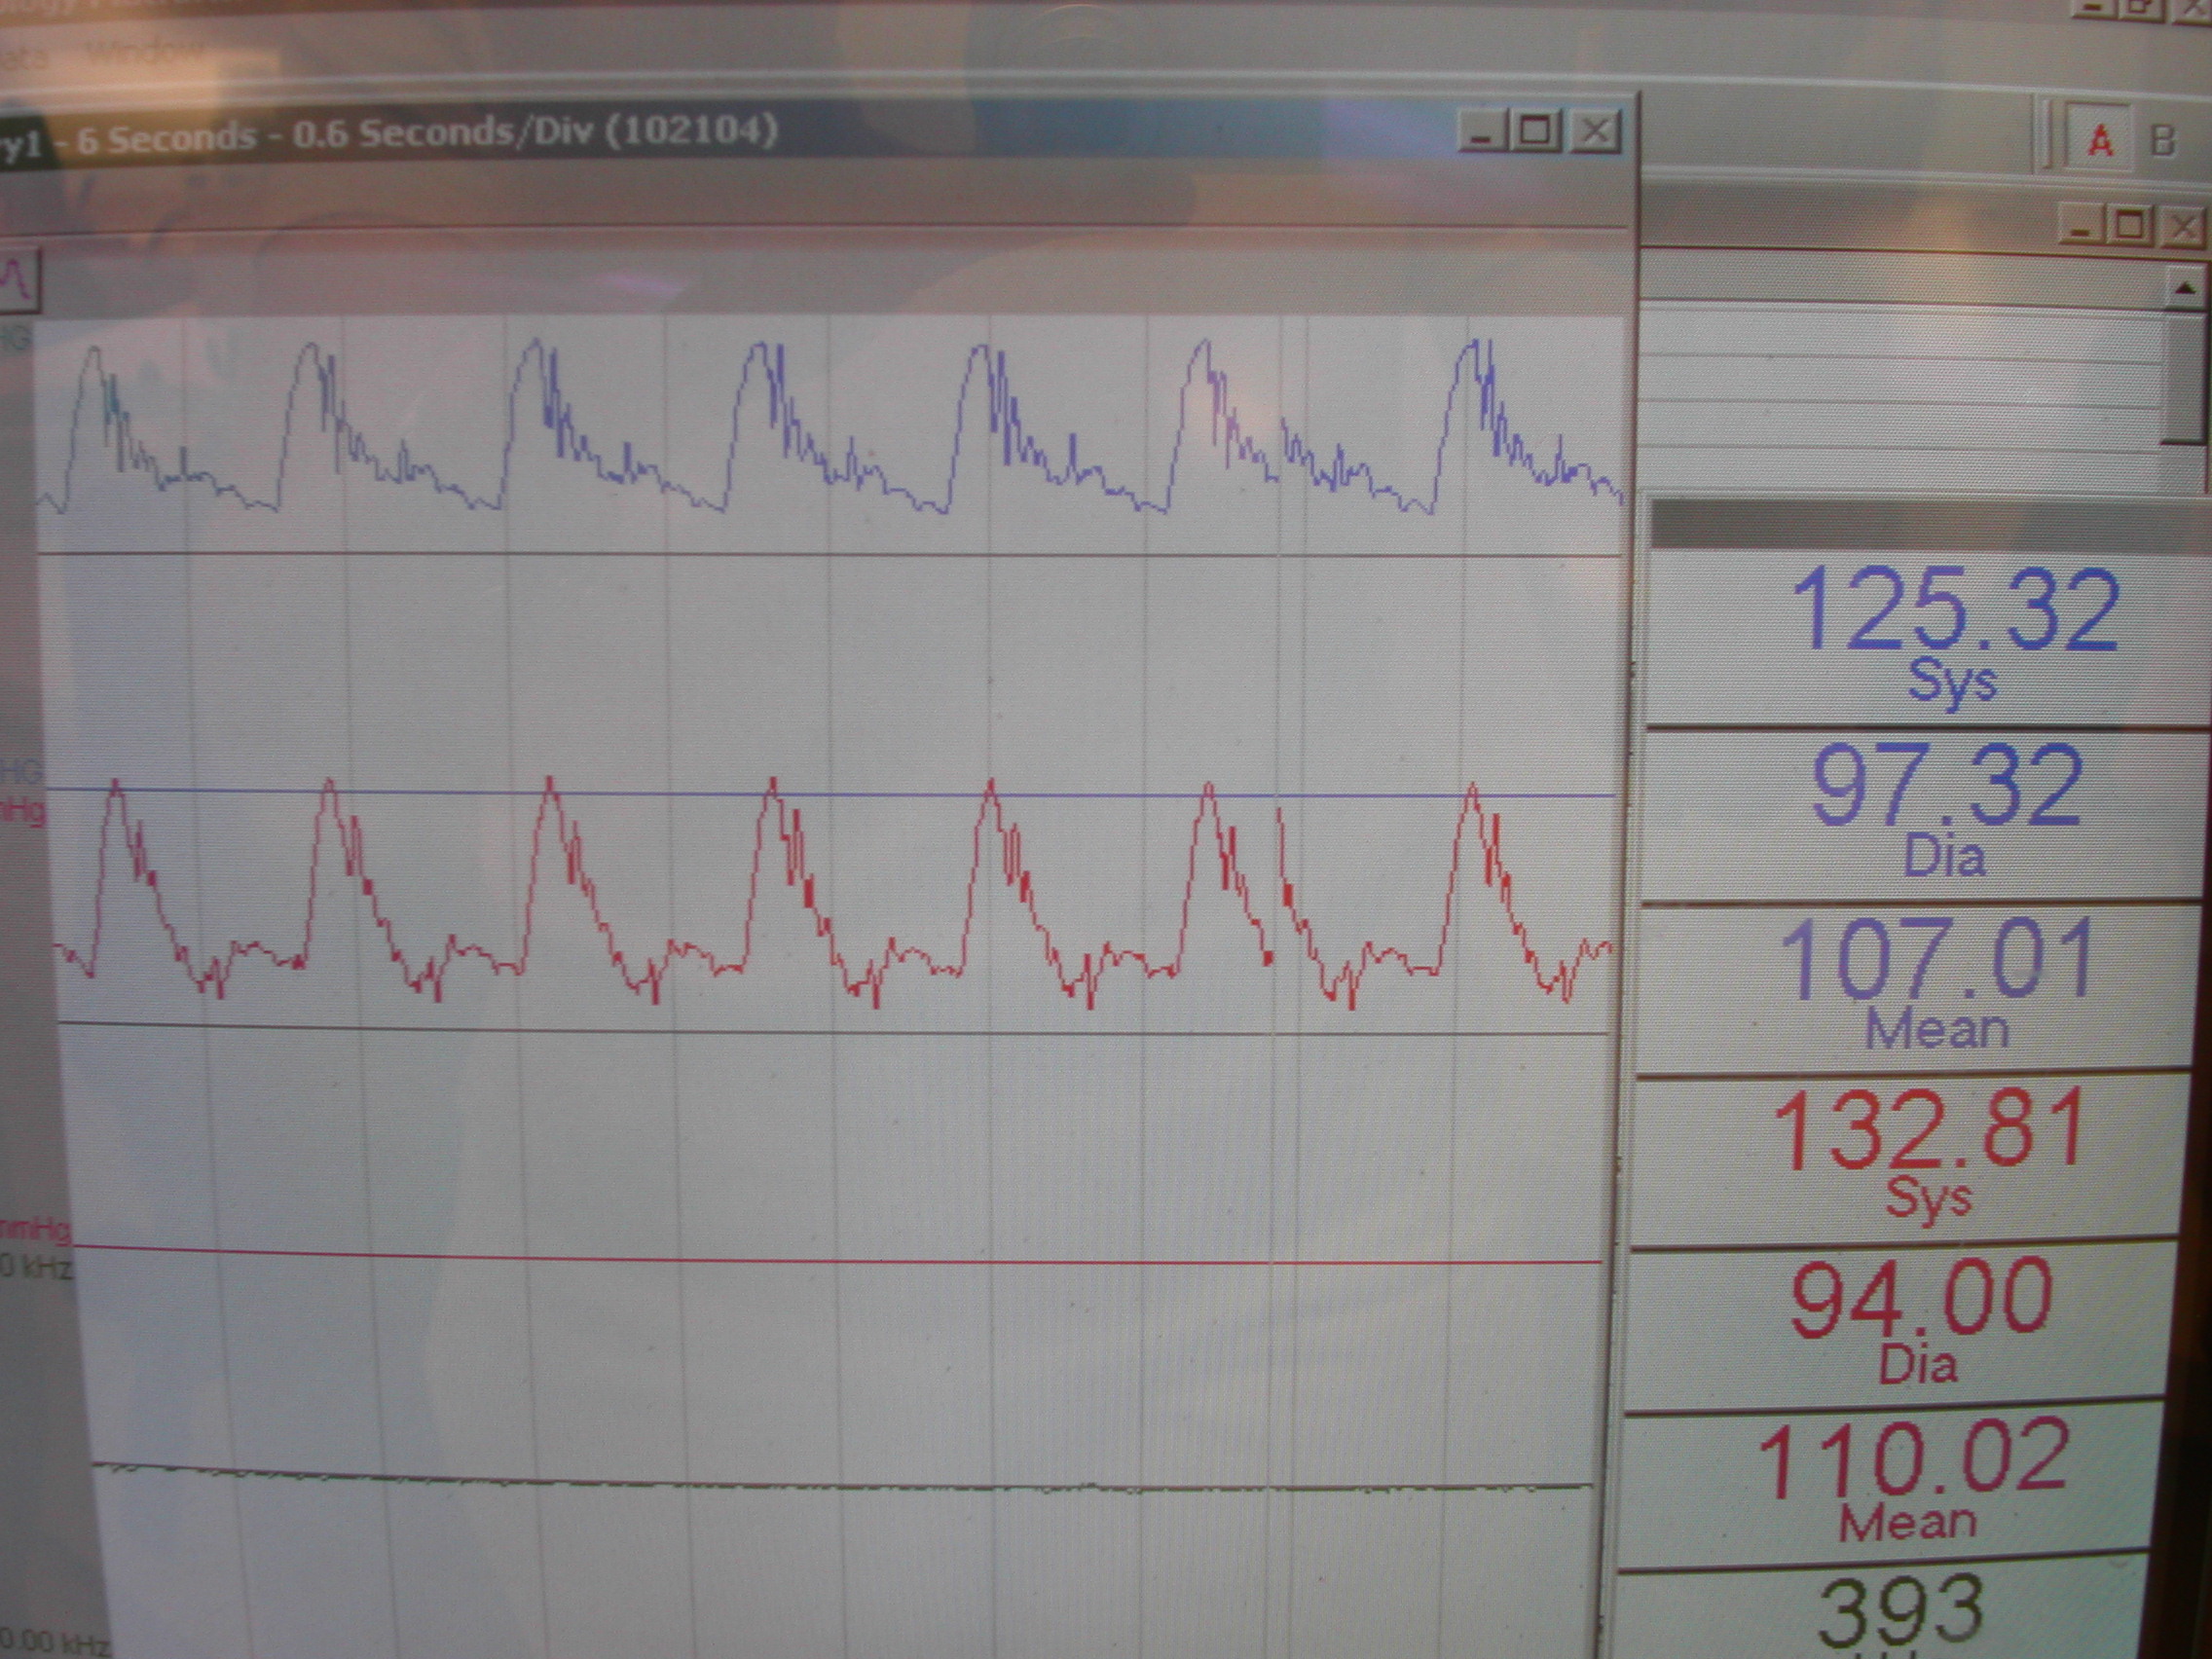
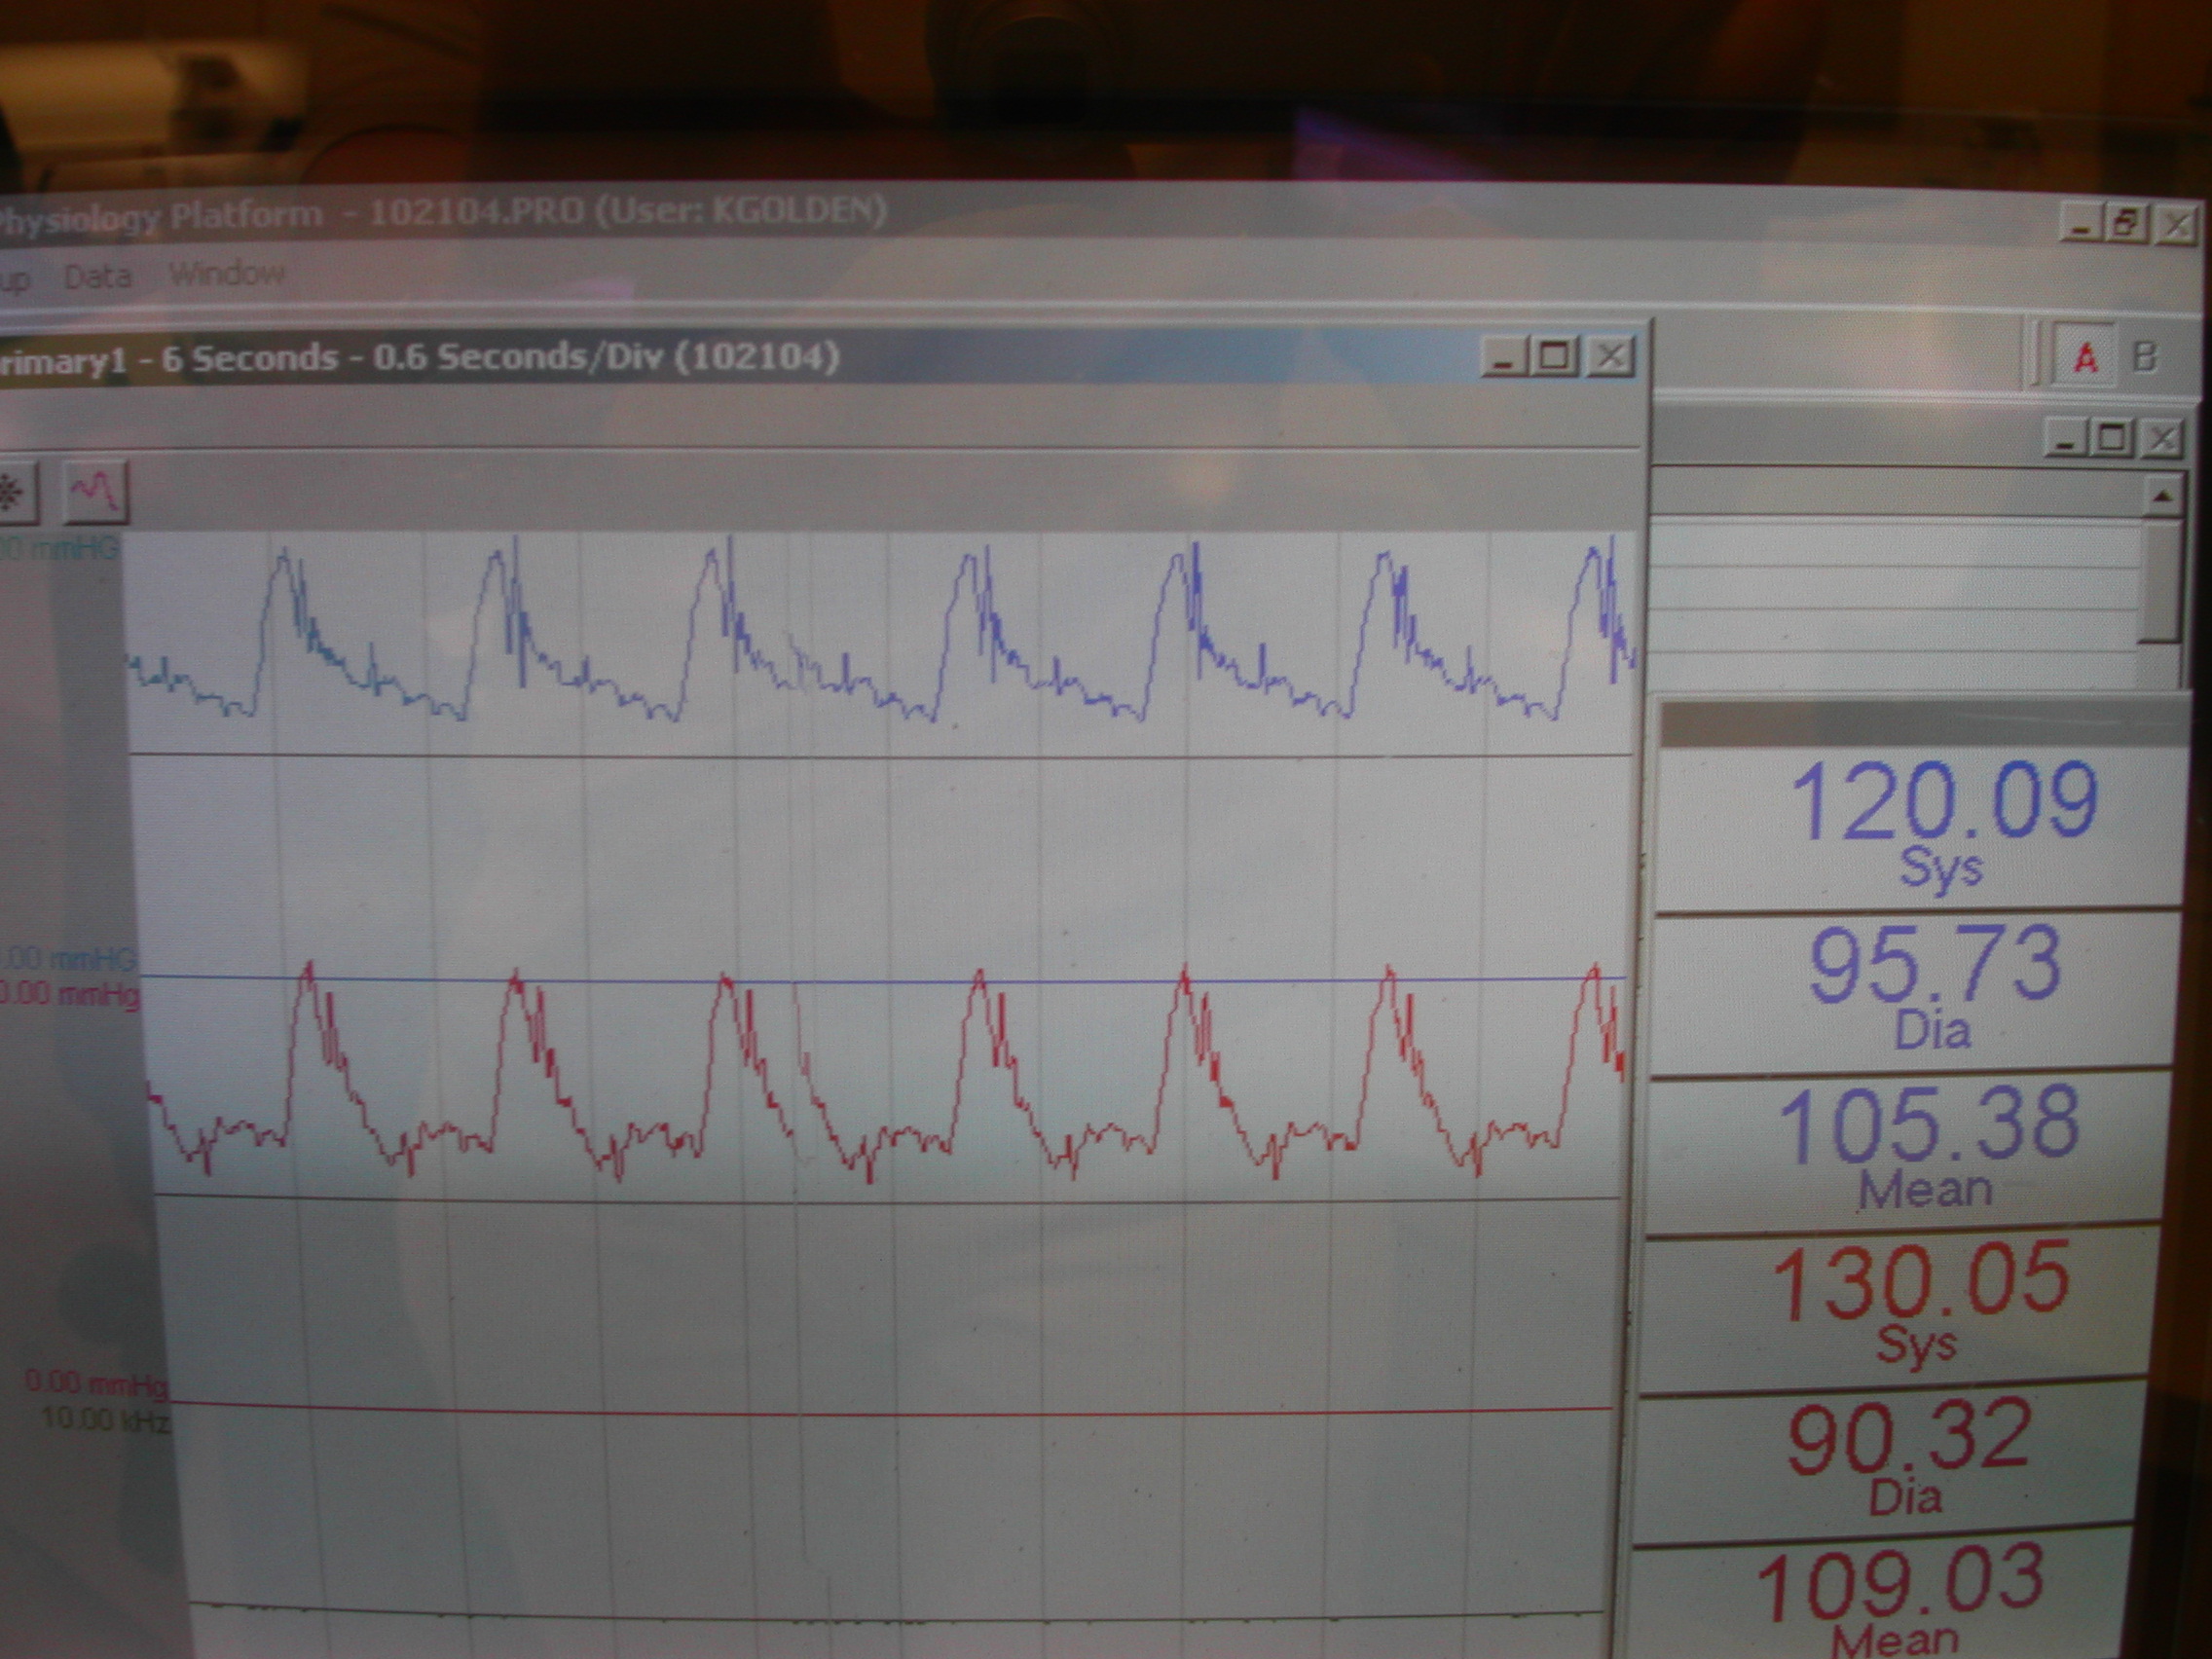
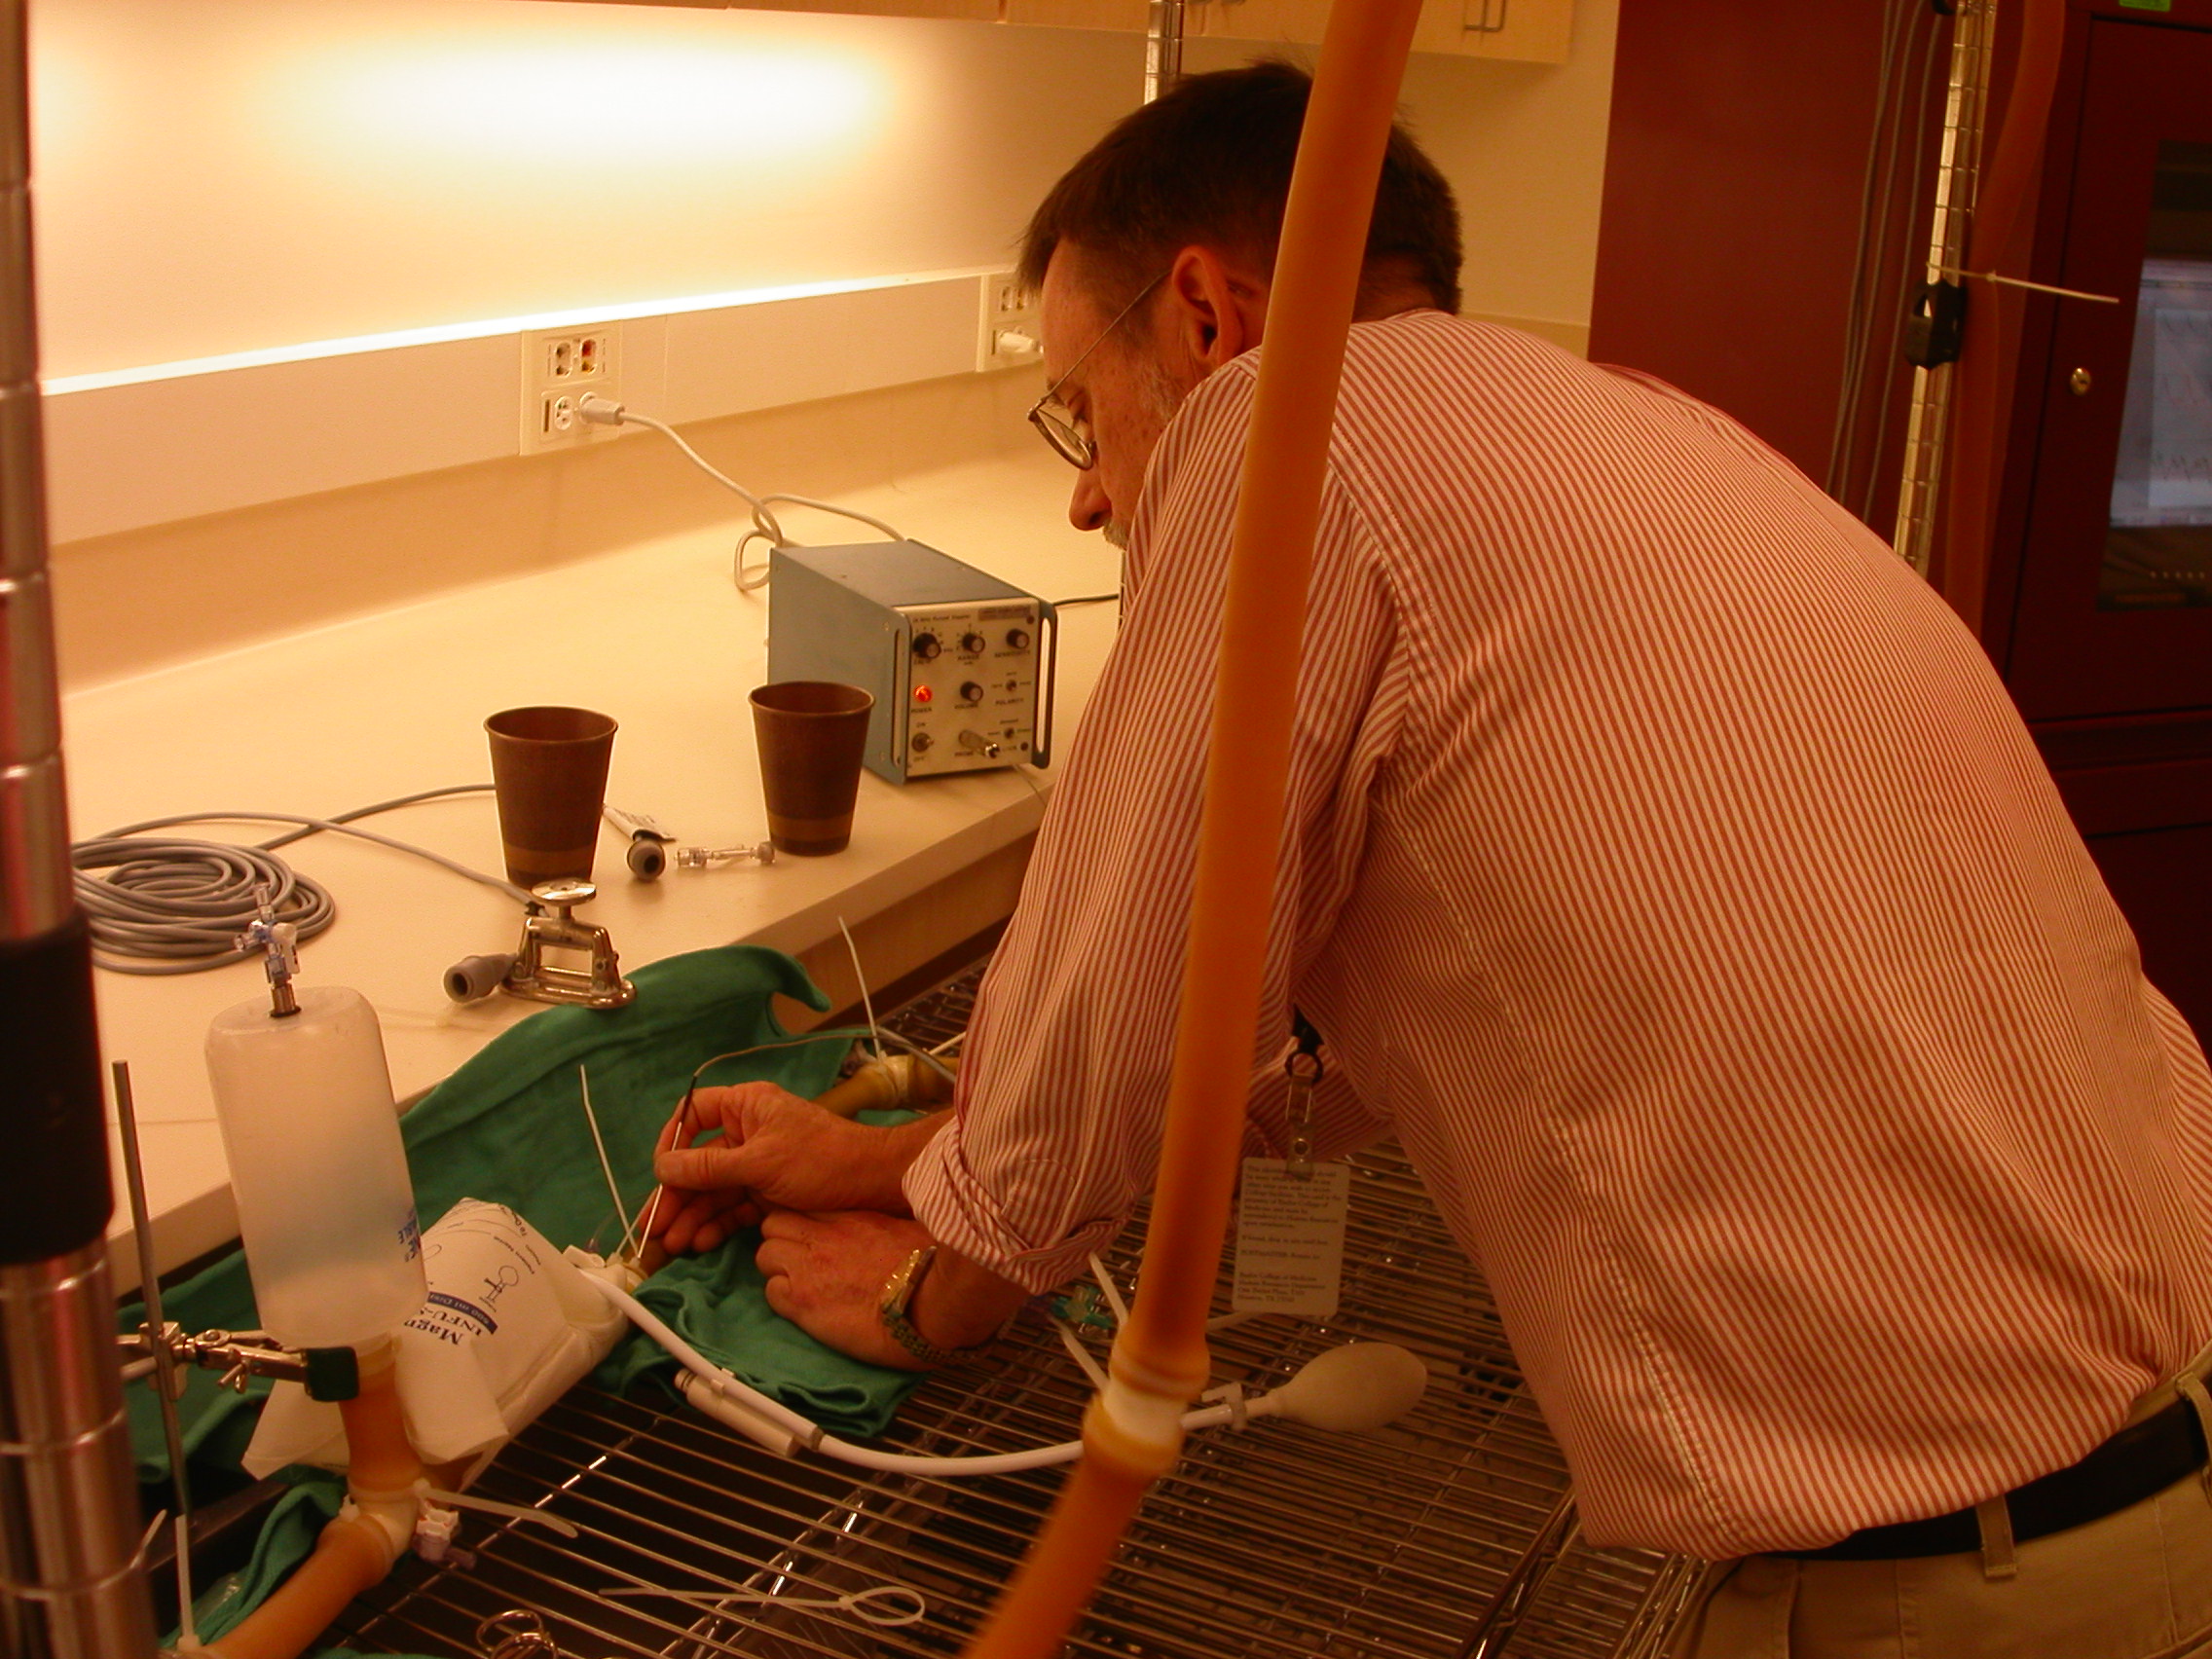
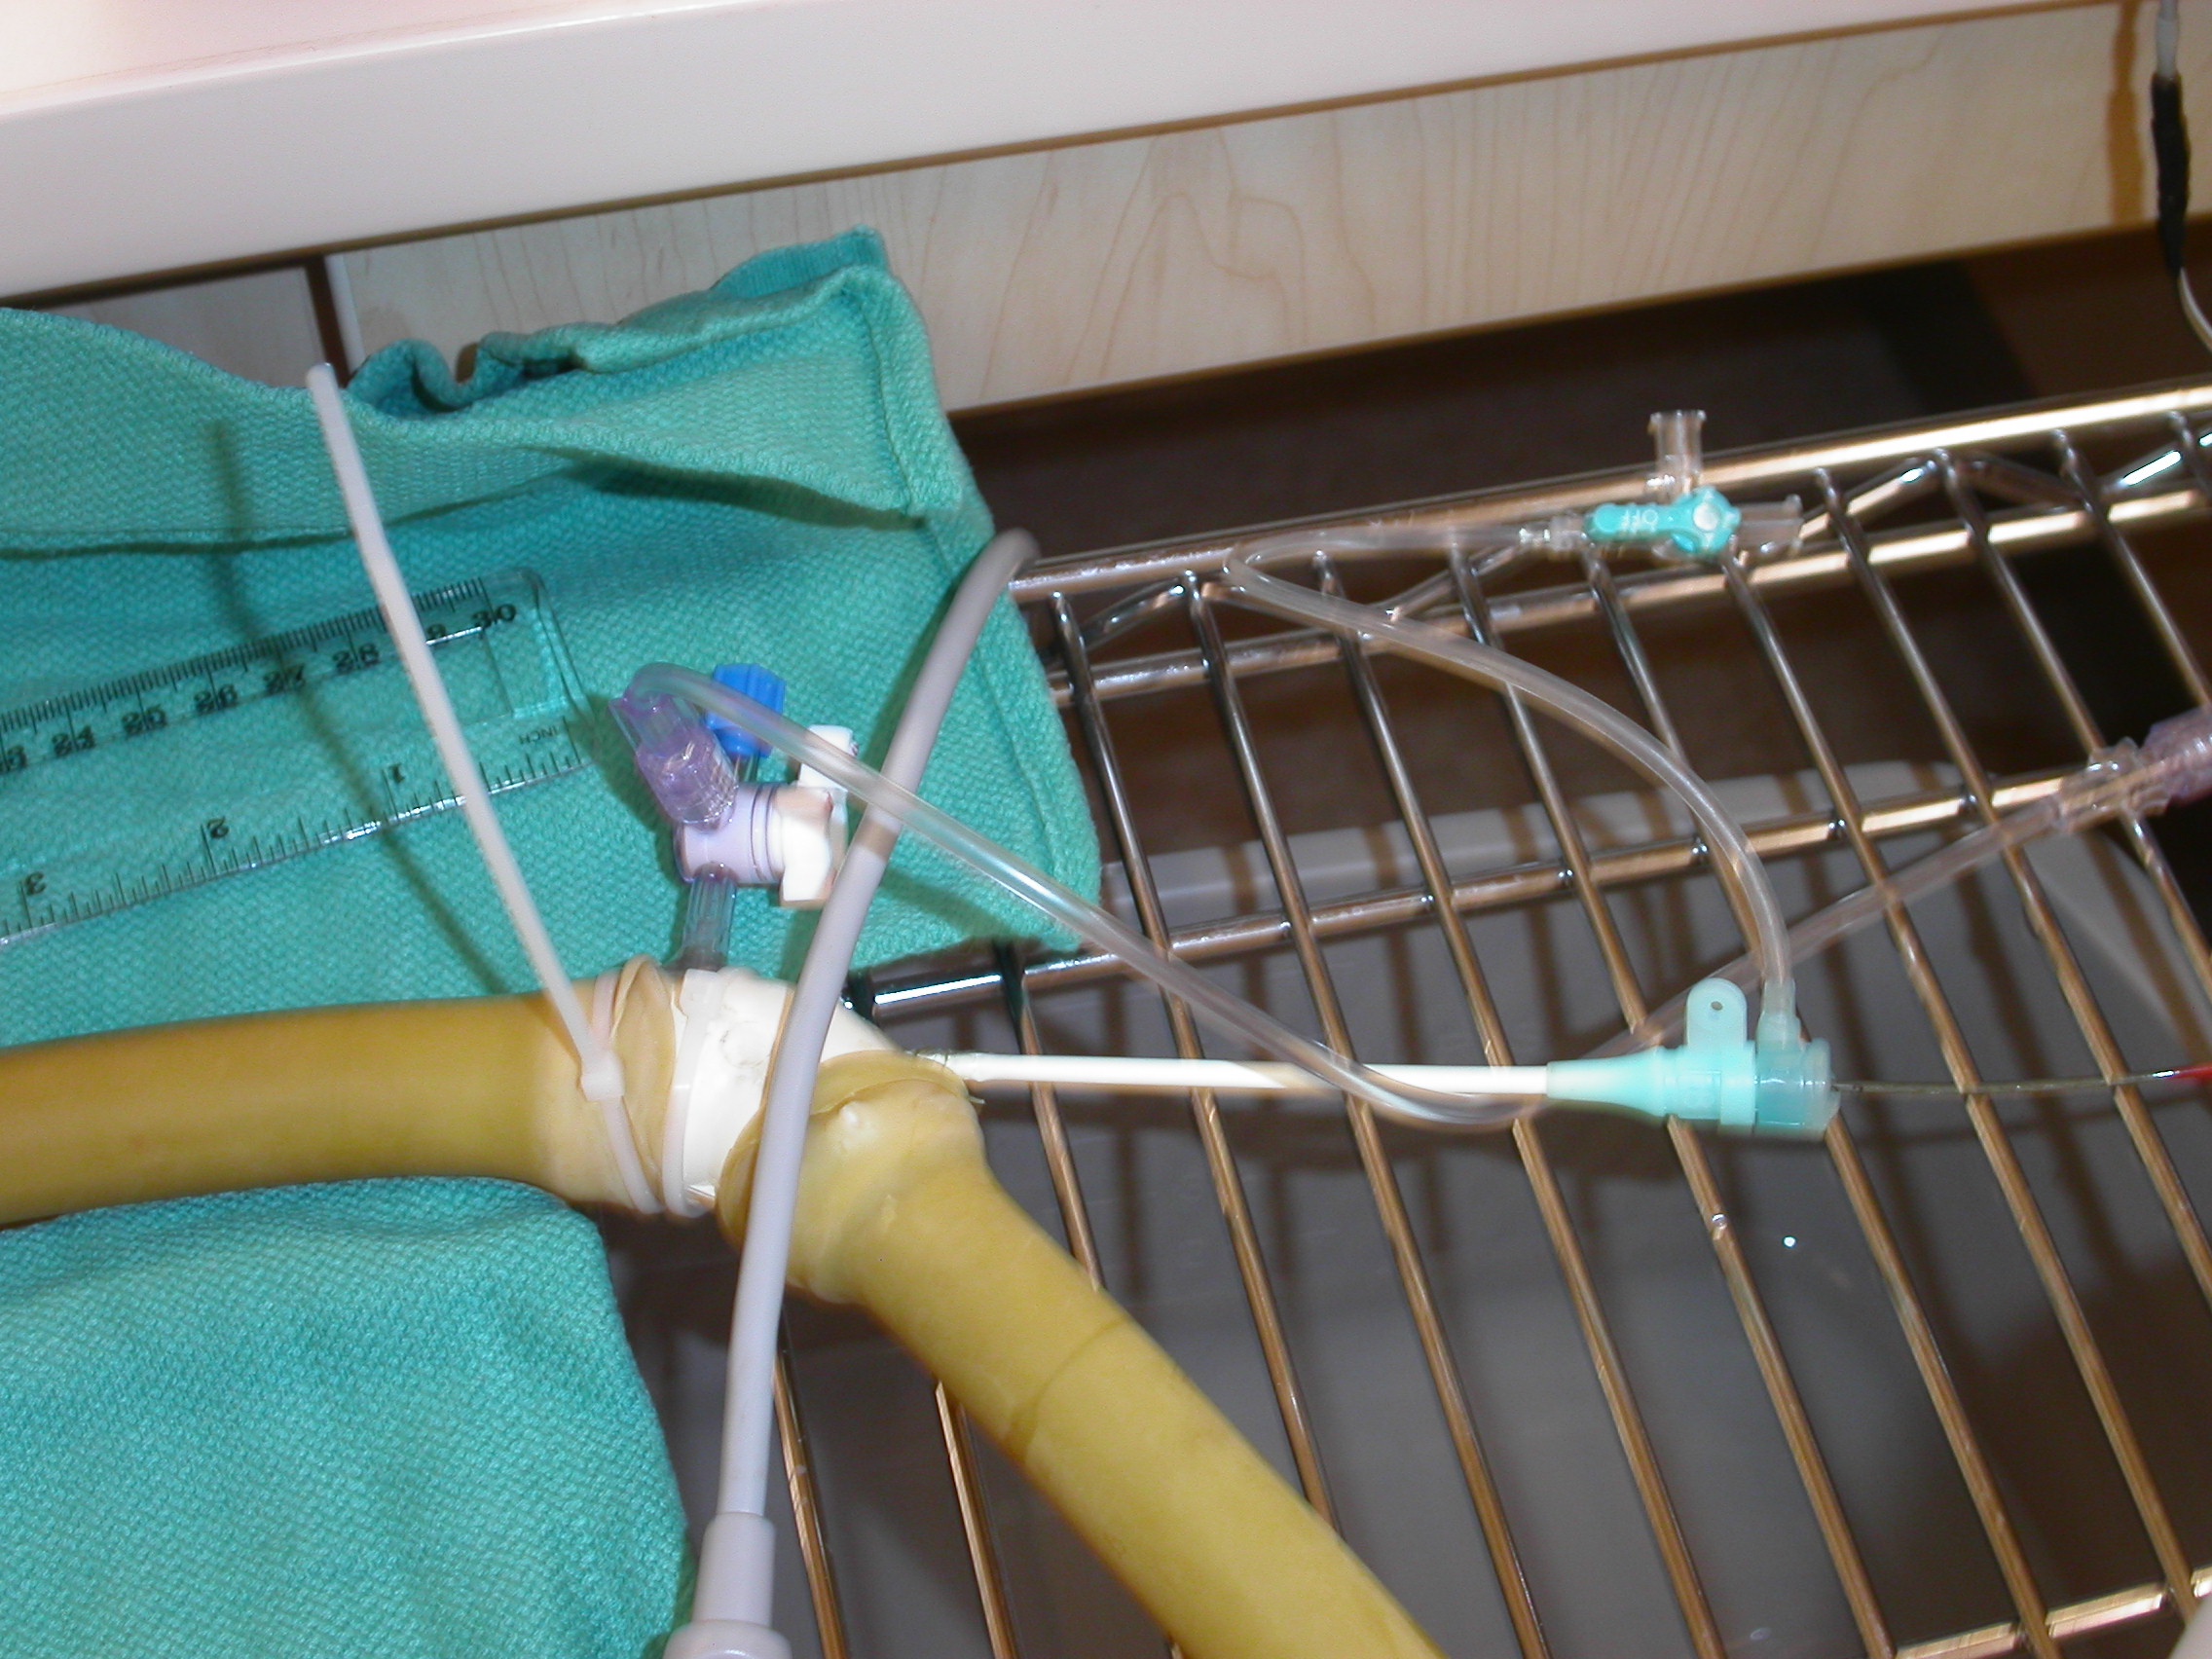
following pictures and movies show the experimental setup and some
results obtained from our Mock Circulatory Flow Loop built at
the Texas Heart Institute by the above mentioned patricipants.
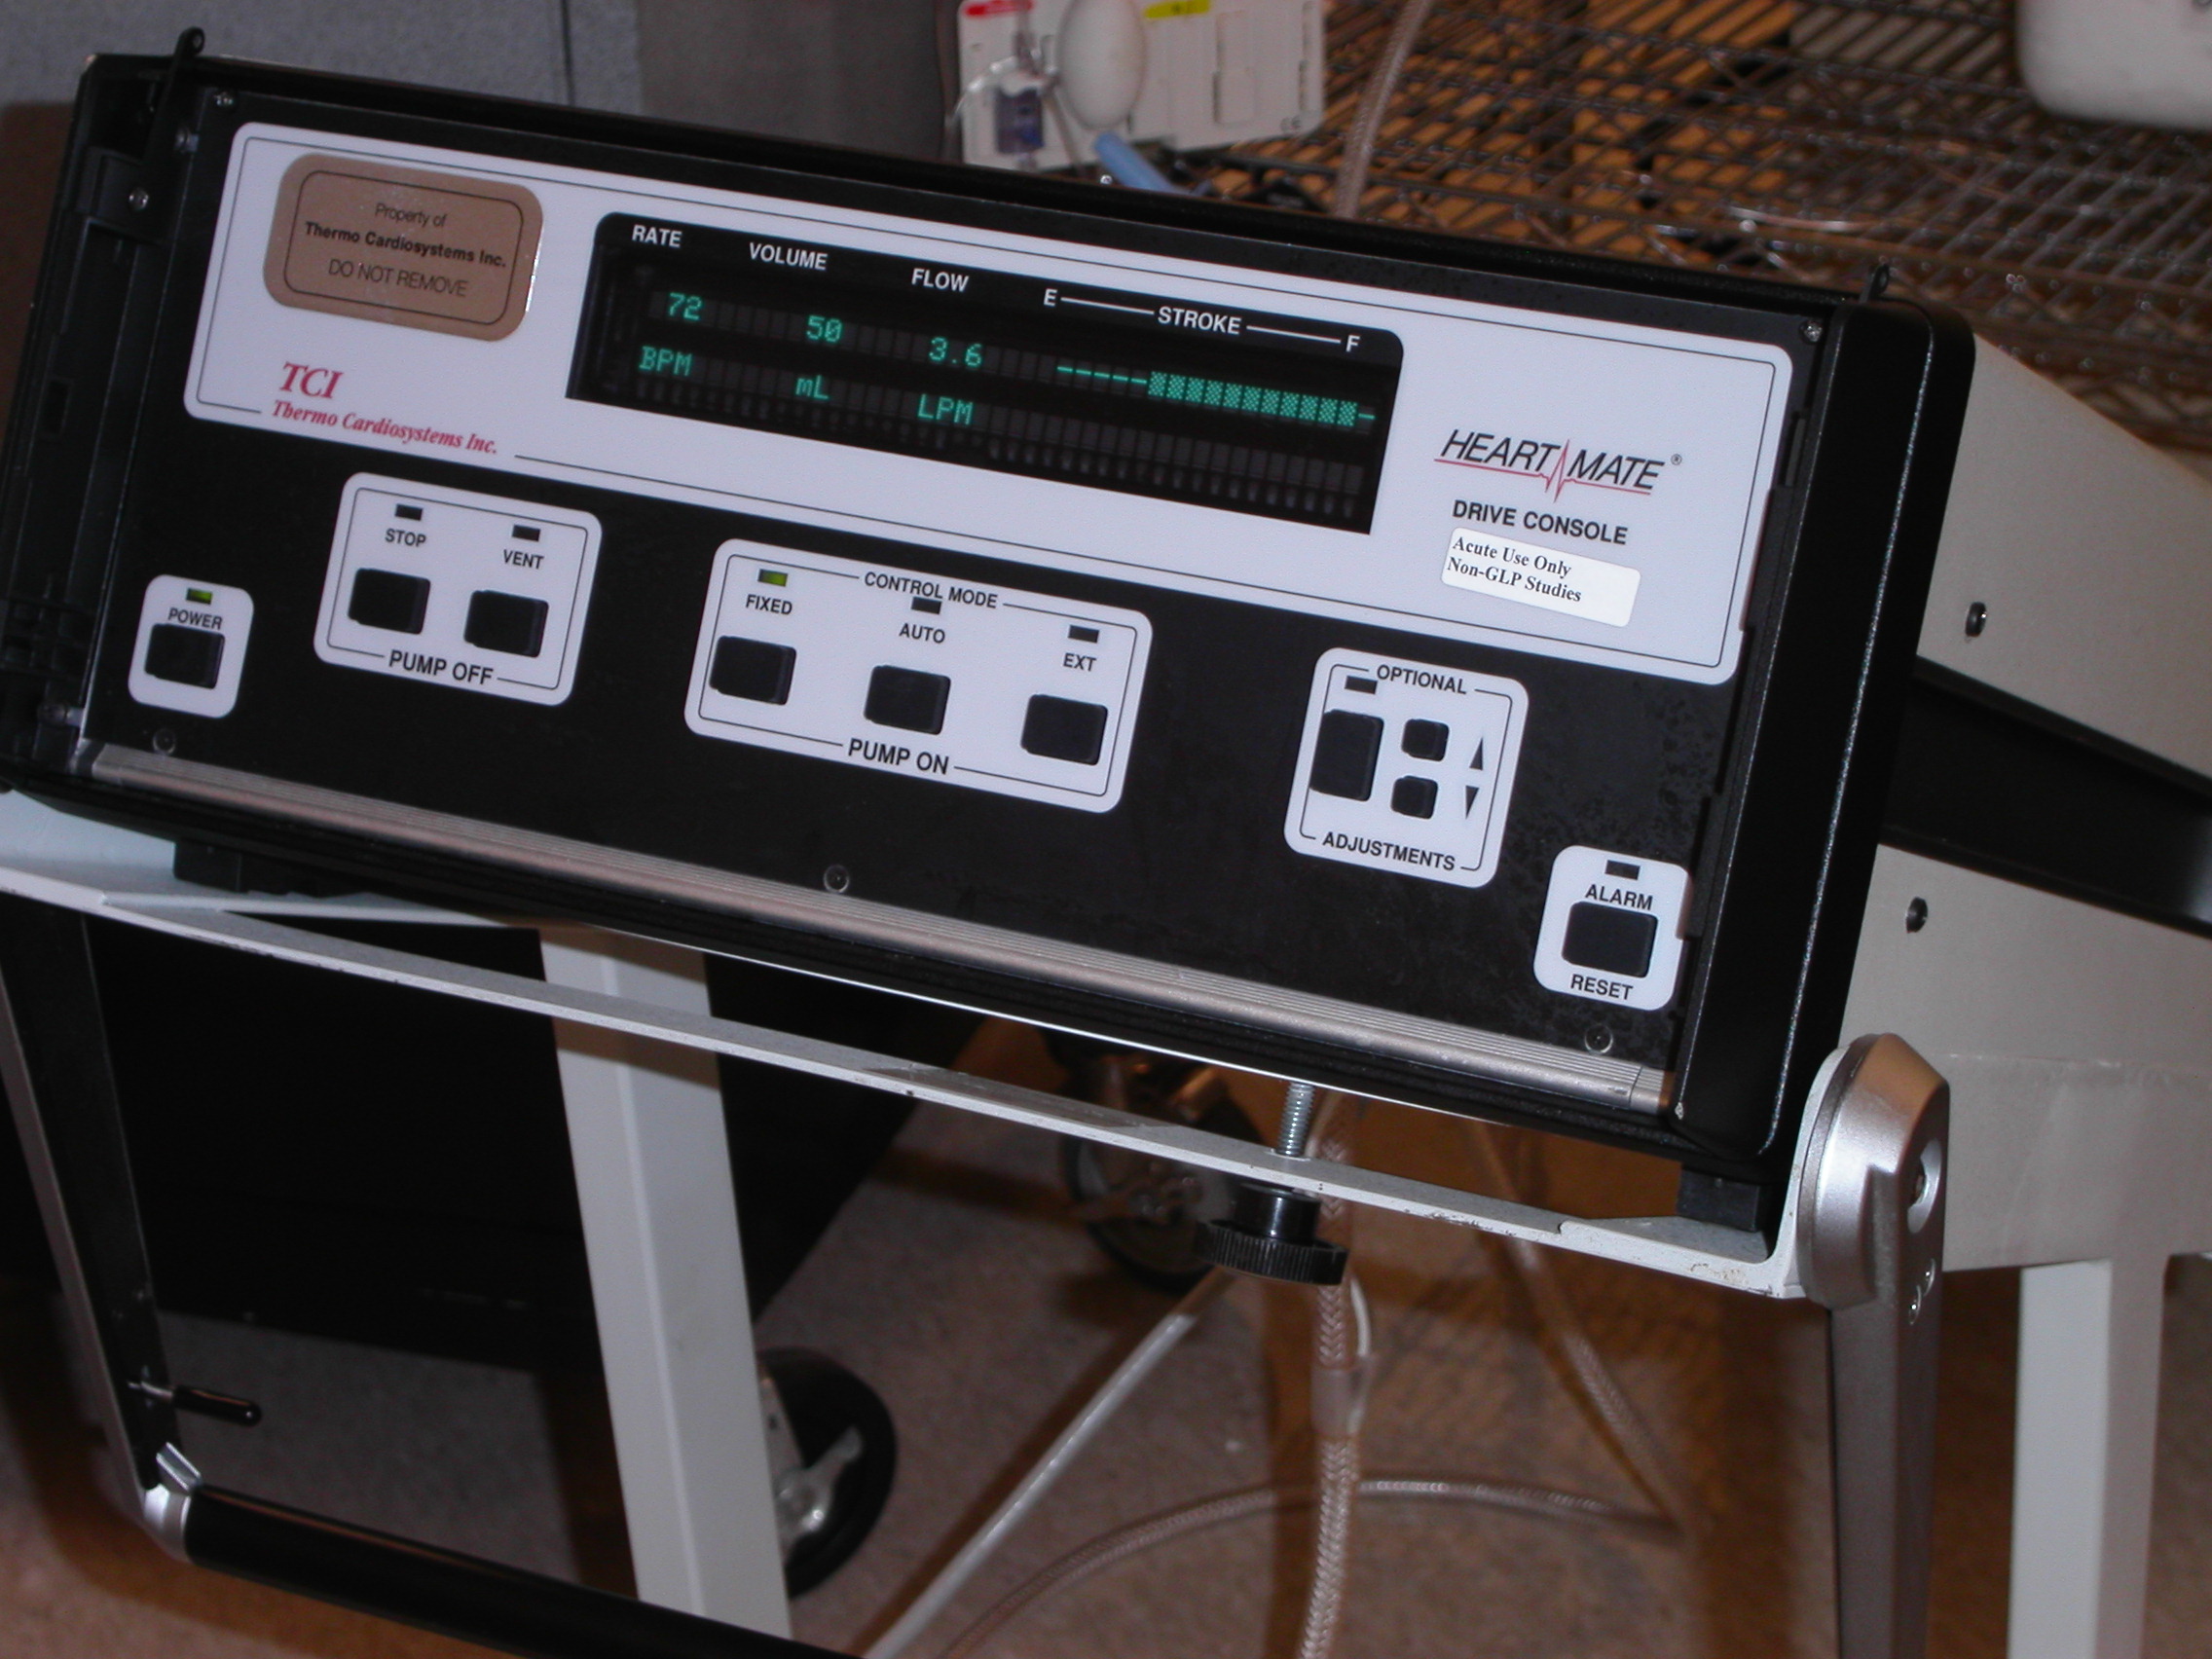
The flow loop uses a Left Ventricular Assist Device (LVAD; purchased using
Roderick Duncan MacDonald Research grant
awarded by St. Luke's Episcopal Hospital)
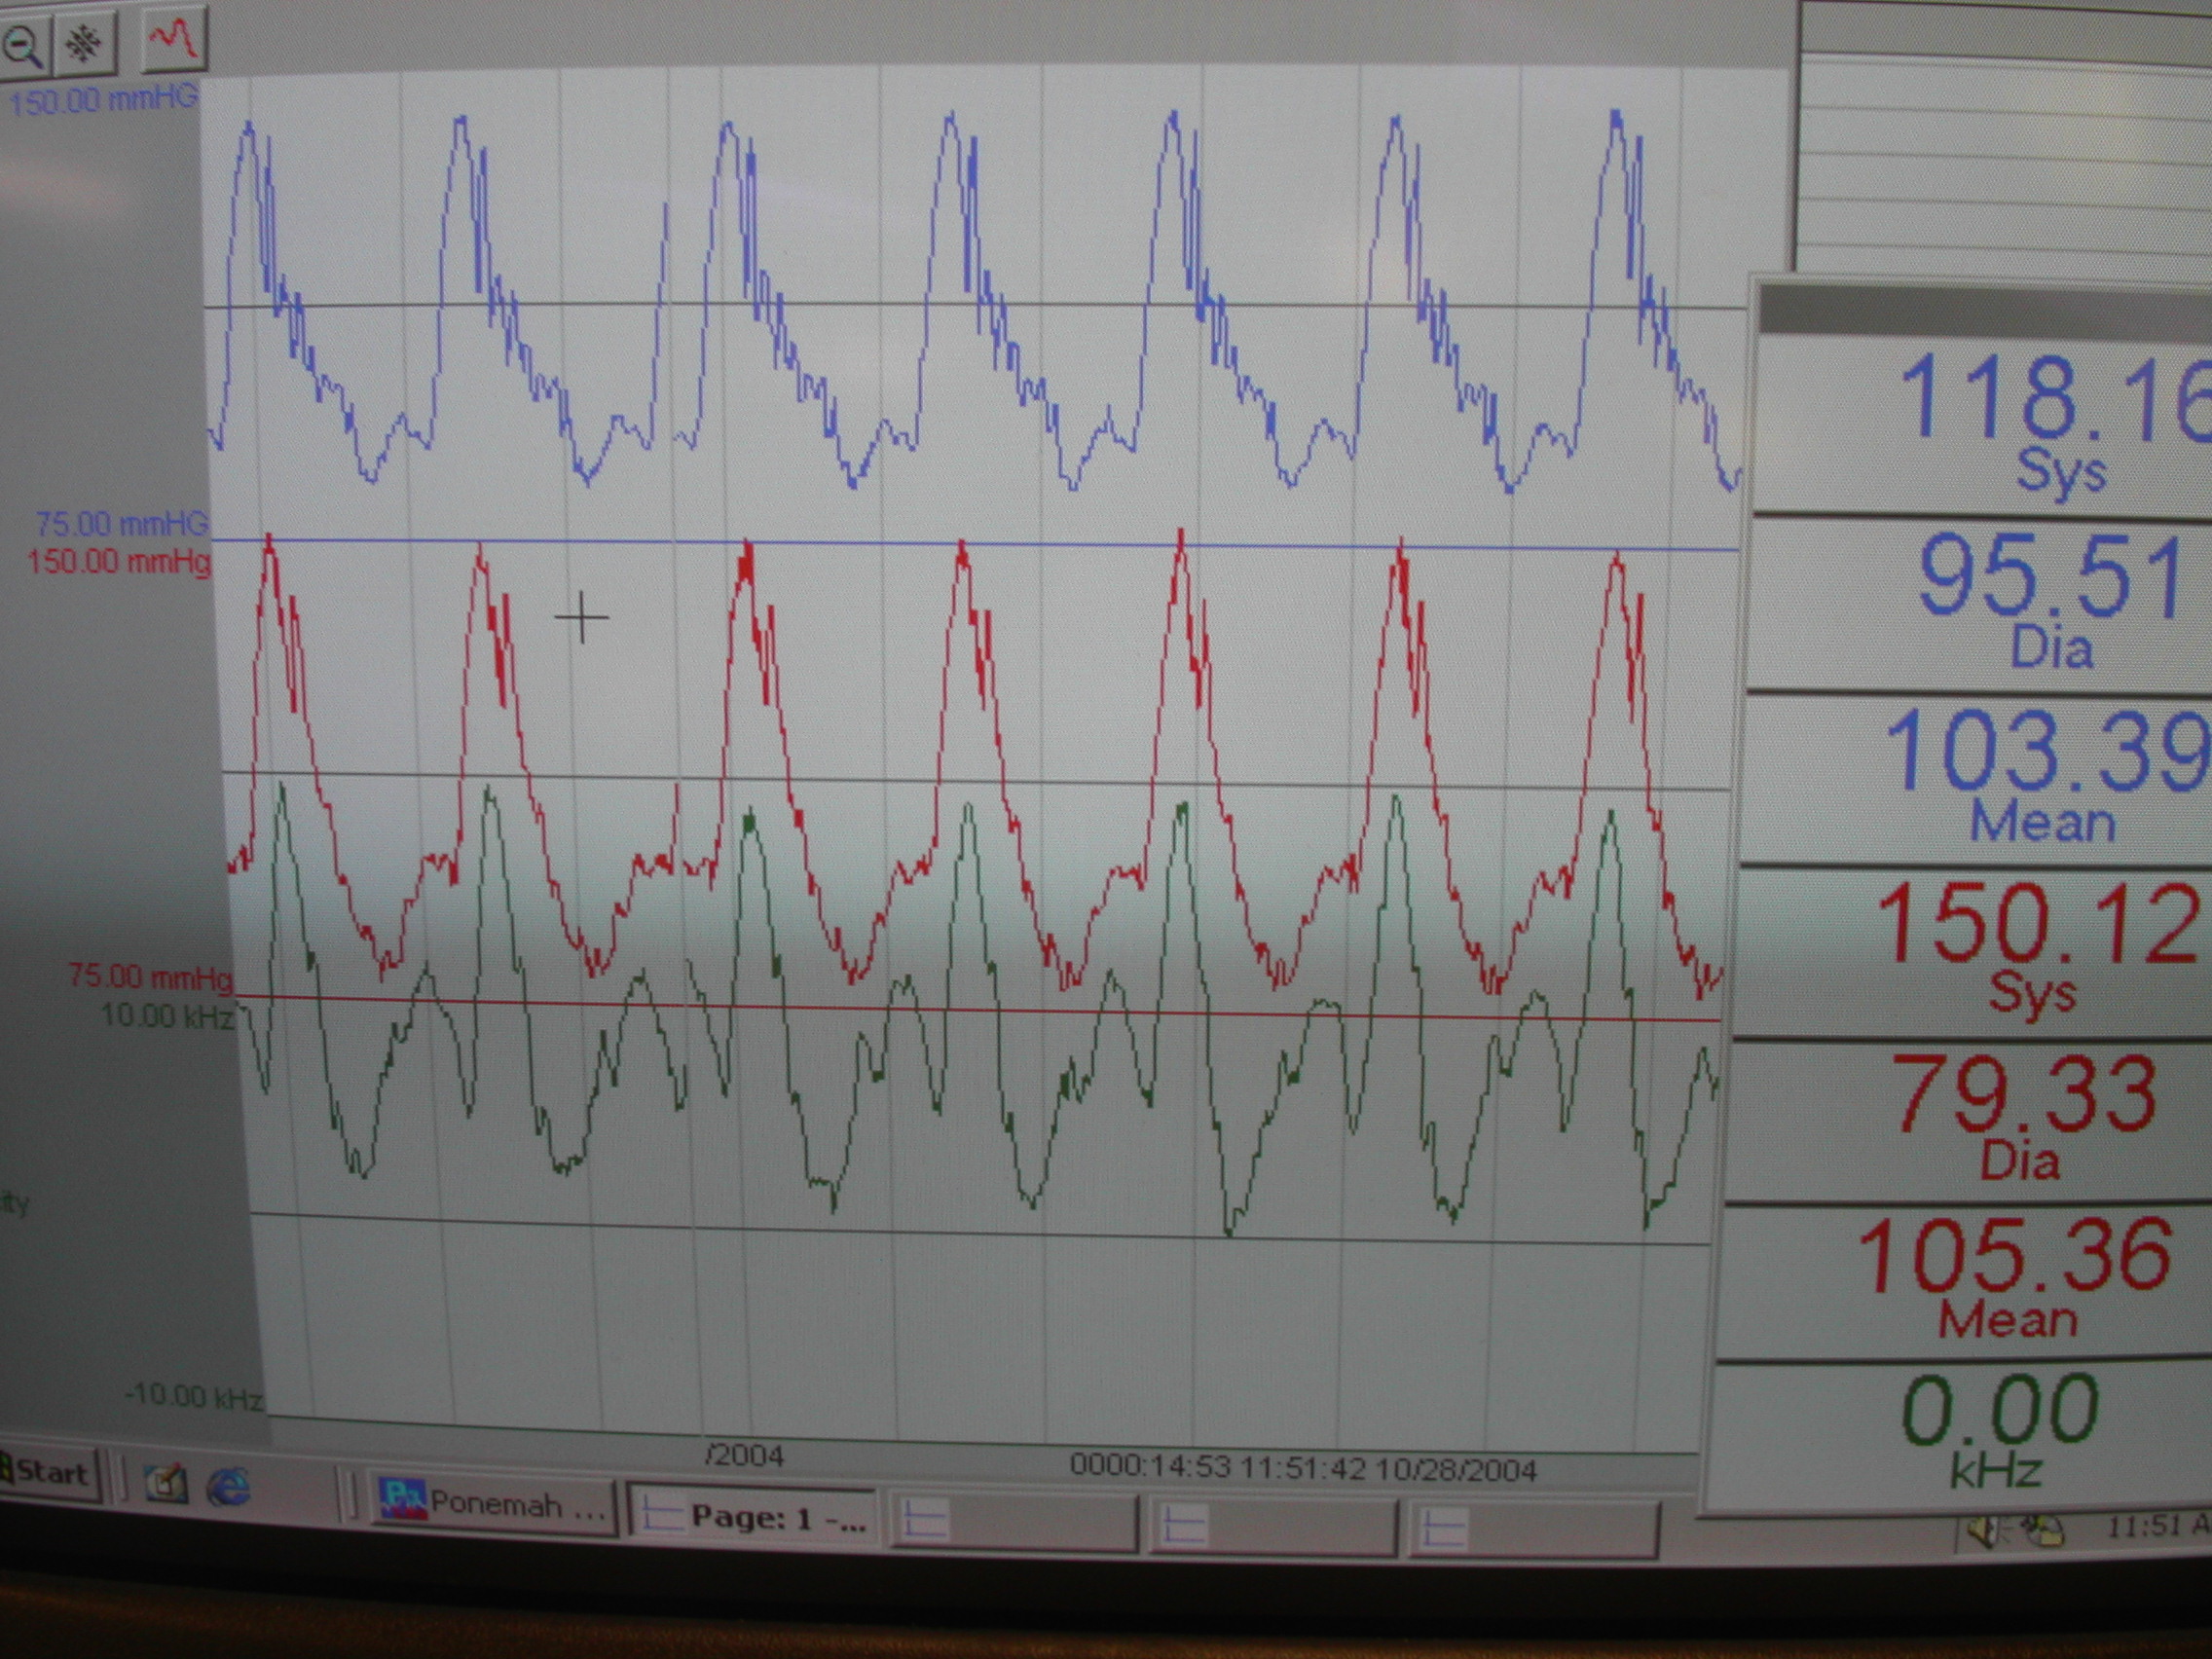
as a pulsatile flow pump generating physiologically reasonable
pressure waves, and a custom-made latex tubing (donated by Kent Elastomer Inc.)
as an elastic flow conduit.
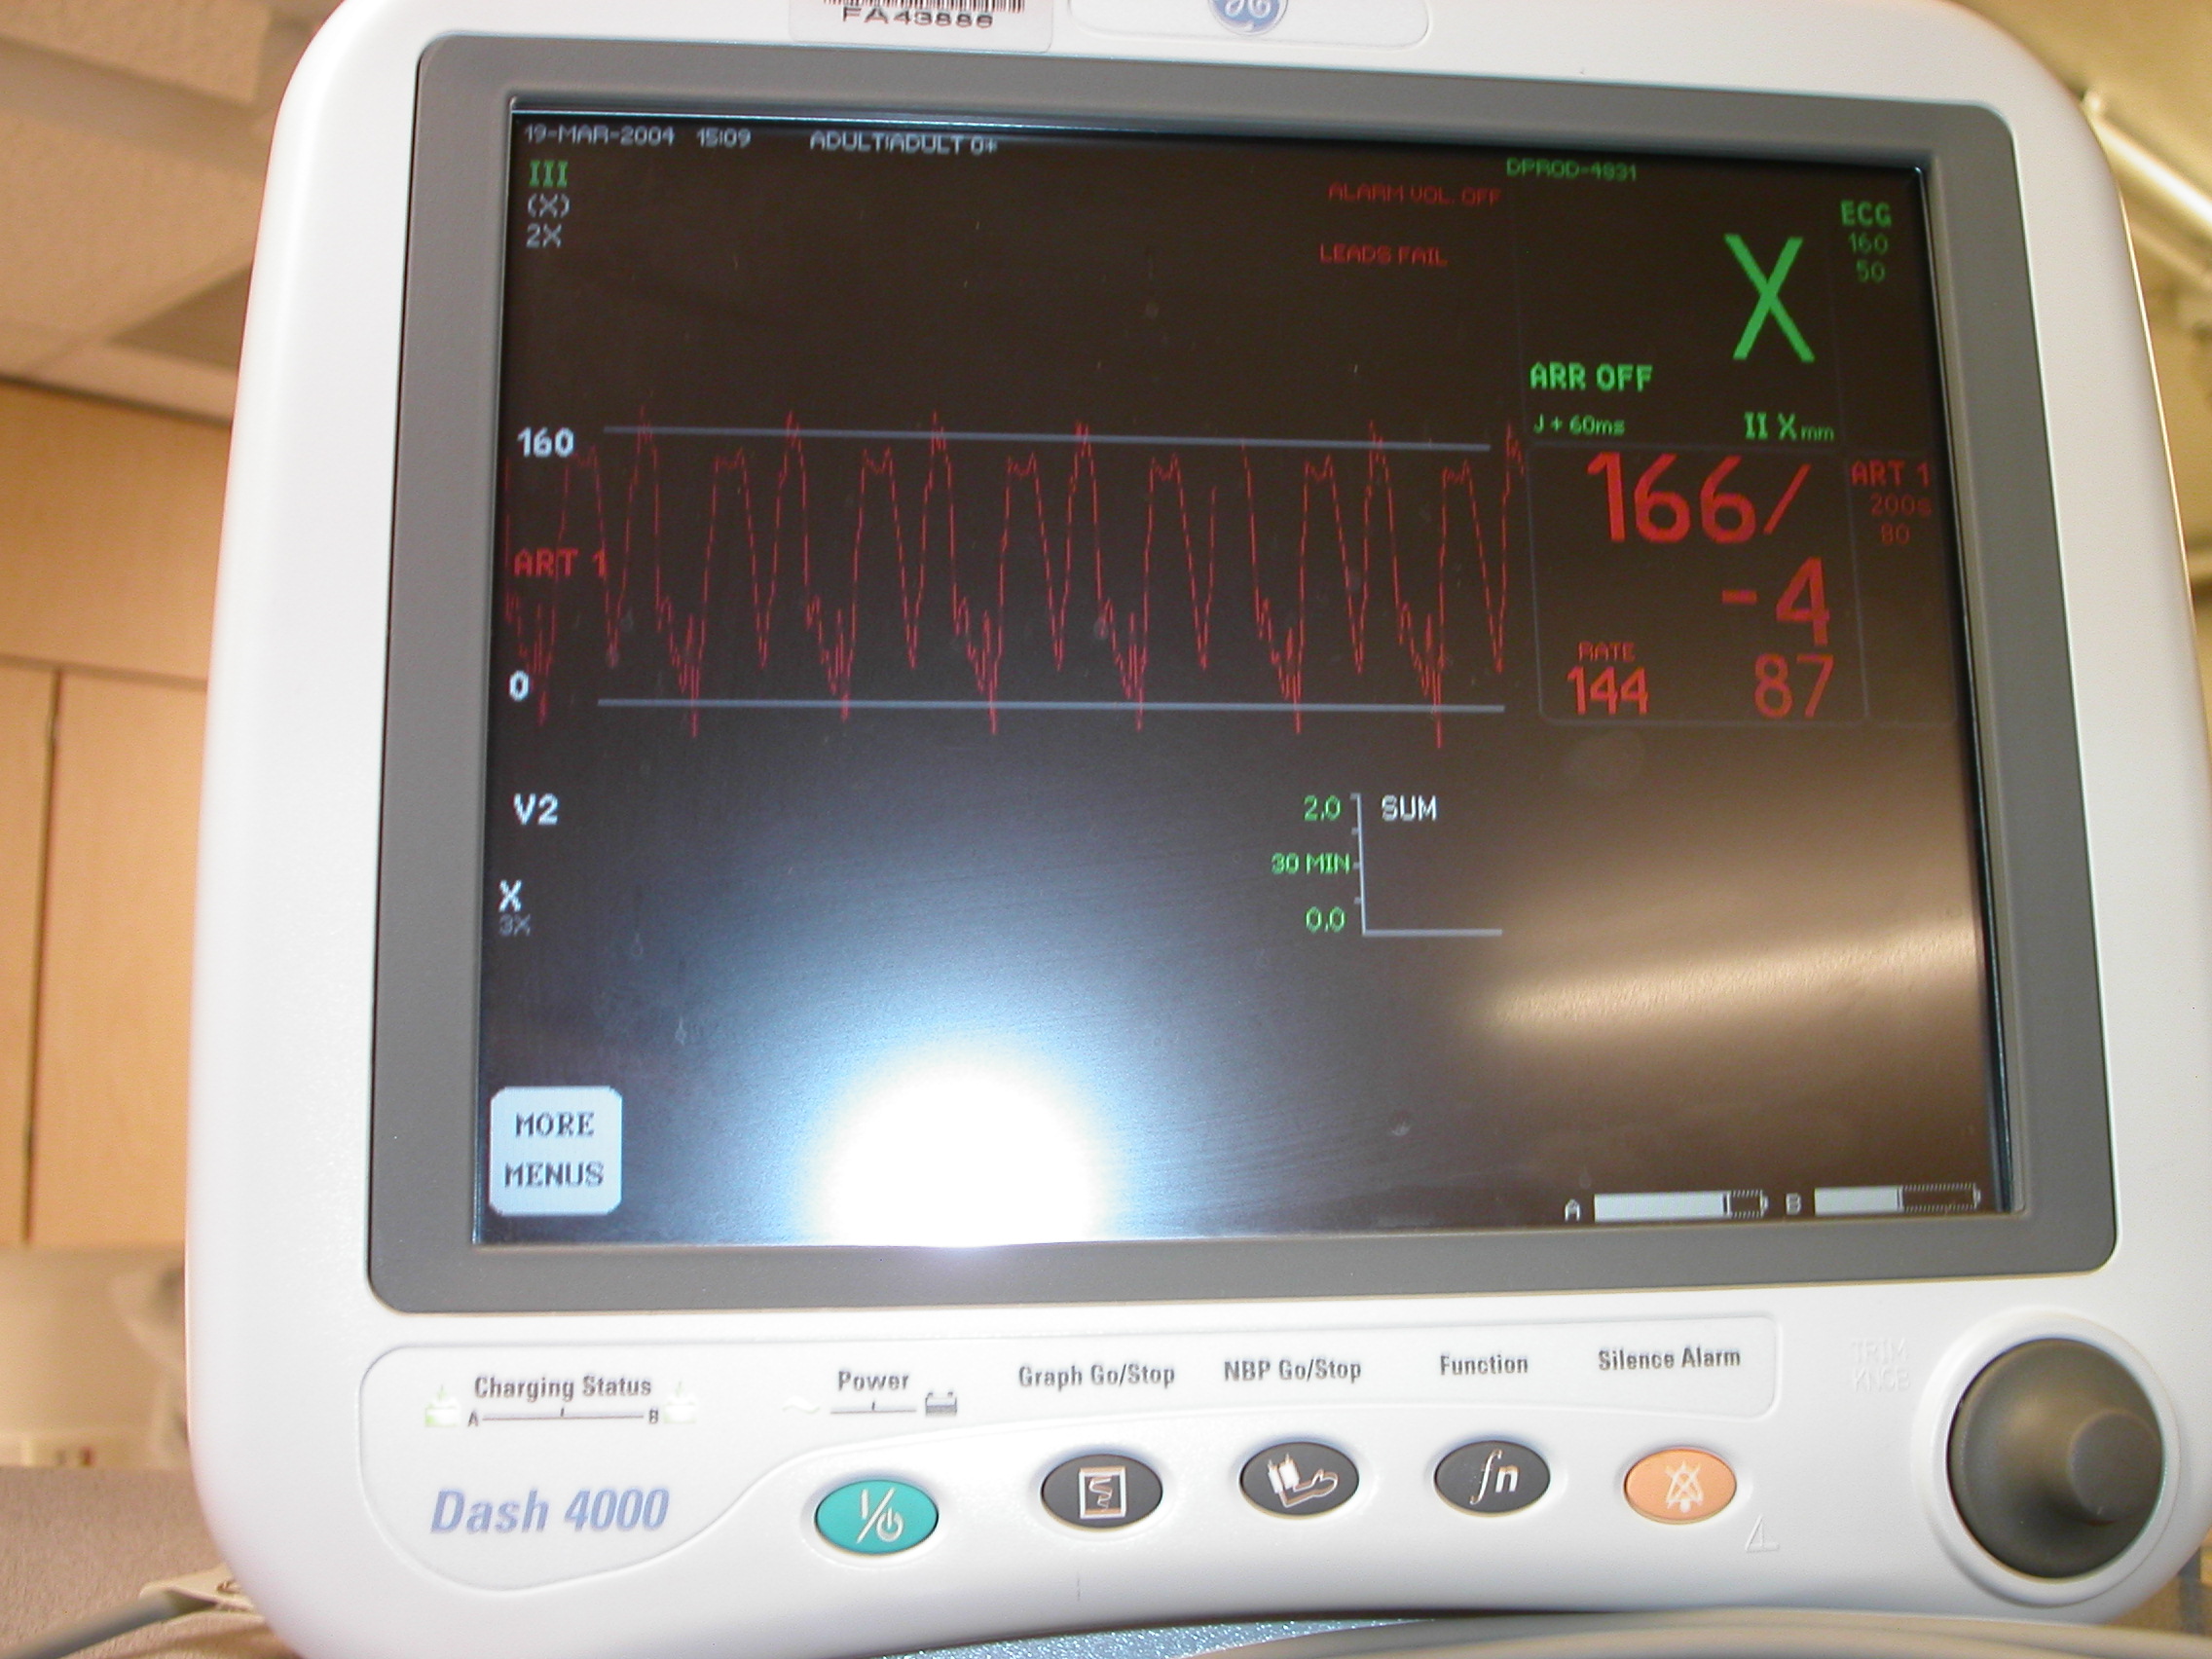
Ultrasound measurements of wall motion and of the flow velocity
were performed by Dr. Hartley, whose expertise is in cardiovascular ultrasound measurements
and instrumentation.
Excellent agreement between the experiment and numerical simulations
of the reduced Biot system was obtained.
Validation of a mathematical model for fluid-structure interaction
between a viscous incompressible Newtonian fluid and an elastic structure;
Validation of a mathematical model for fluid-structure interaction
with an inserted vascular prosthesis (AneuRx Stent-Graft; donated by Medtronic Inc.)
Derivation of new models for viscoelastic behavior of vessel walls coupled
with the time-dependent flow of a viscous incompressible Newtonian fluid
Testing a viable human aorta with and without the inserted prosthesis
Research plan:
Click on
picture to enlarge or run a movie.