Undergraduate Colloquium
Jeff Morgan
University of Houston
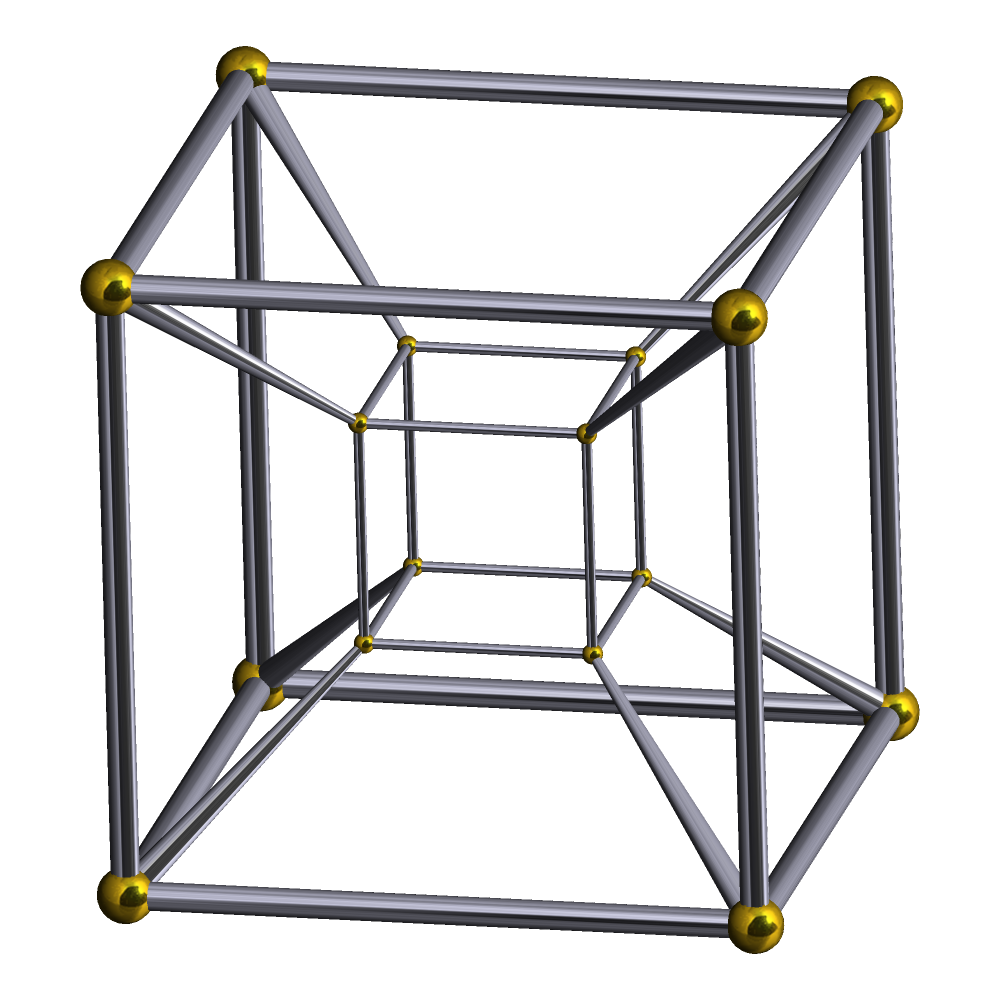
Making Sense of Things – Using Simple Mathematics to Visualize Objects in Multidimensional Space
November 2, 2012
1:00pm 104 AH
| Abstract |
|
Most students have plotted a curve in 3 dimensional space by using a professional software package such as Matlab, SciLab, Octave, Maple, Mathematica, Spacetime or R. But not many students have taken the time to think about how this process works. We'll discuss the simplest mechanism for visualizing curves in 3 space, and just for fun, we'll implement the method using Excel. Then we will extend this idea to obtain "views" of n-dimensional cubes, for n = 3, 4, 5, 6, 7 and 8. 
|
www.math.uh.edu/colloquium/undergraduate