Please fill out the information below First Name: Last Name:
UH ID Number: Once you have that information filled out, click the button below to begin your test.
Click on any image to open in a new tab
Question 1
Question 2
Question 3
Question 4
Question 5
Question 6
Question 7
Question 8
Question 9
Question 10
For Questions 11 - 14, write your answers and work on the paper provided Questions
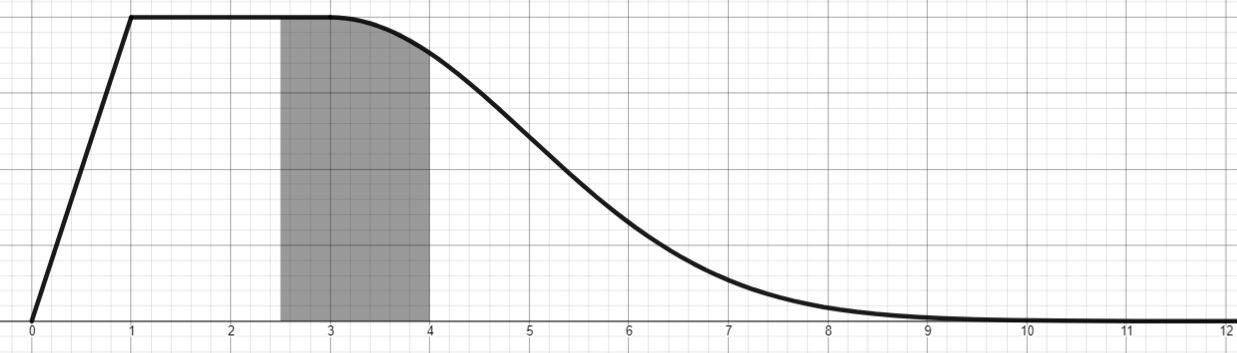
Question 11
Part A: Determine the height of the uniform portion of f(x). Part B: Given that the shaded region has an area of 0.2915, determine the value of s. Part C: Determine the values of the upper and lower quartiles.
Question 12
Part A: Identify the Explanatory and Response Variables. Part B: Determine the equation of the LSRL. Part C: Calculate and interpret the correlation coefficient and coefficient of determination. Part D: Calculate the residual for the explanatory value of 35. Part E: Extrapolate the response value for an explanatory value of 100. Would another non-linear model provide more accuracy here?
Question 13
Part A: Is this an observational study or an experiment? Why?
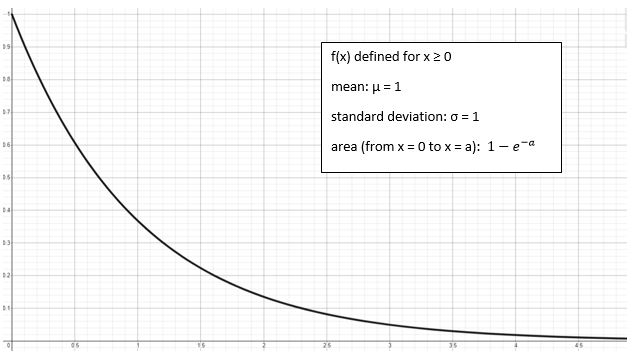
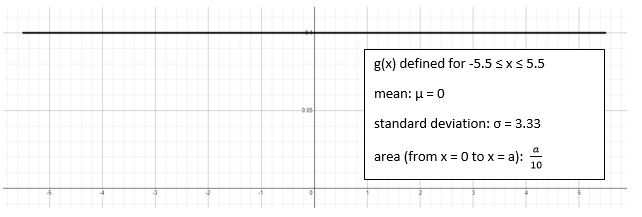
Question 14
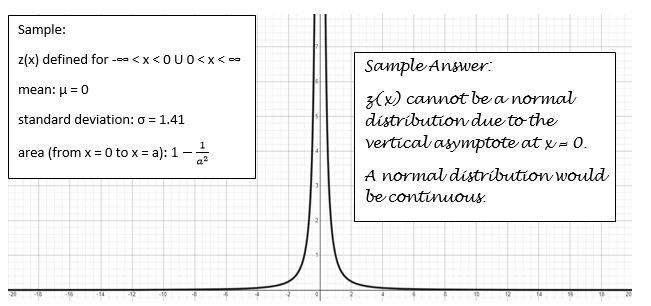
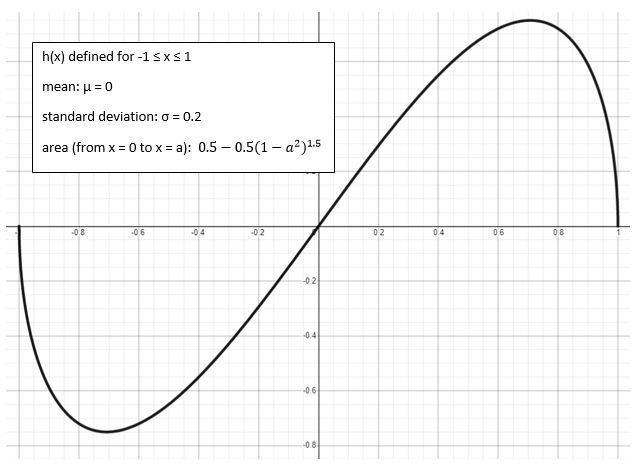
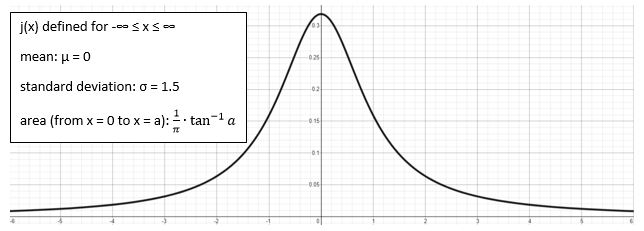
Consider the following functions: f(x), g(x), h(x), j(x), and k(x) with their graphs, means, standard deviations, and a formula to calculate their enclosed area between x-values of 0 and a. Discuss a trait of each function that disqualifies it as being either a probability density function or as a normal distribution, and how this trait would appear in a normal distribution. Traits to discuss include: symmetry, positive and negative values, total area enclosed, shape, and empirical rule (use each trait only once, so plan ahead).
Click here for additional R Studio commands to help with these.
A sample function, z(x), and acceptable solution is provided below: