Random Walk with Threshold
This script uses the function randomWalkThreshold to plot and display some statistics.
Contents
Parameters
Obtaining 10^4 random walks, each one with 2*10^3 points. The probability of going right(up) is 0.75. System resets when size == 100.
a = .75;
threshold = 100;
nPoints = 2e3;
nTrials = 1e4;
Running simulation.
tic;
[x, y, minLength] = randomWalkThreshold(a, threshold, nPoints, nTrials);
seconds = toc;
fprintf(1, 'Time spent in function randomWalk : %g seconds.\n', seconds);
Time spent in function randomWalk : 2.09965 seconds.
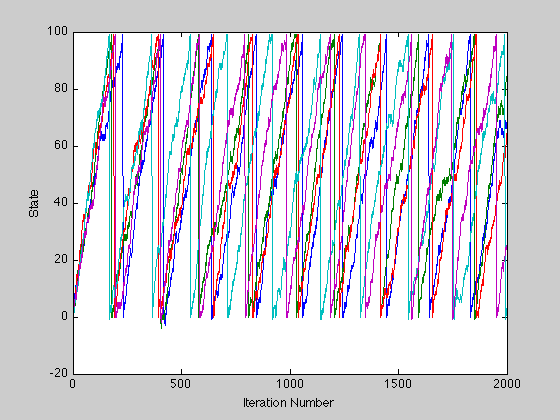
Plot
Plotting only 5 trials in a new figure.
figure;
plot(x(:, 1:5));
xlabel('Iteration Number');
ylabel('State');
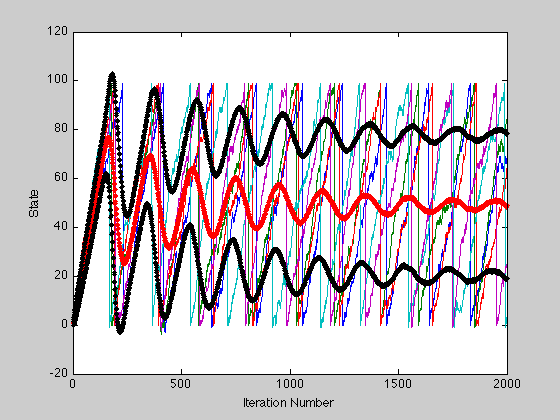
Plotting the mean and standard deviation.
tic;
m = mean(x, 2);
s = std(x, 0, 2);
seconds = toc;
fprintf(1, 'Time spent computing mean and std : %g seconds.\n', seconds);
Time spent computing mean and std : 0.662961 seconds.
Ploting mean in red with square markers and standard deviation in black.
hold on;
plot(m, 'r', 'Marker', '.');
plot(m+s, 'Color', [0 0 0], 'Marker', '.');
plot(m-s, 'Color', [0 0 0], 'Marker', '.');
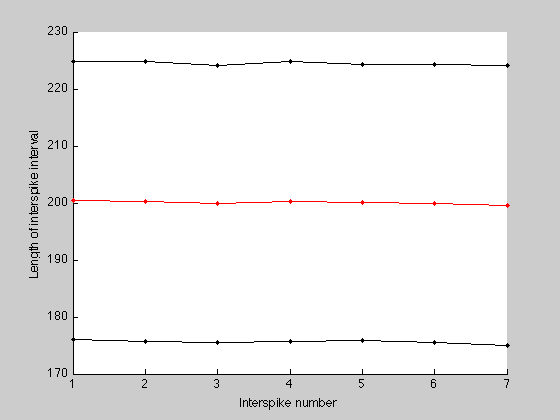
Interspike times.
Obtaining information for the interspike times. Remember that this information is stored in a cell and not all vectors have the same lenght. In order to compute the mean we need to have the same amount of data. This is why we needed to keep track of the minimum length of all the vectors in y.
interspikes = zeros(nTrials, minLength);
for i=1:nTrials
    interspikes(i, :) = y{i}(1:minLength);
end
Computing interspike means and standard deviation.
ism = mean(interspikes);
iss = std(interspikes);
Final plot: Interspikes.
figure; hold on;
plot(ism, 'r', 'Marker', '.');
plot(ism+iss, 'Color', [0 0 0], 'Marker', '.');
plot(ism-iss, 'Color', [0 0 0], 'Marker', '.');
xlabel('Interspike number');
ylabel('Length of interspike interval');